Results
| Country: | U.S.A.
| | Station: | NYSSA OR | | River: | SNAKE RIVER | | Area: | 152023.99 | | Lat: | 43.87 | | Lon: | -116.98 | | Source: | USGS | | PointID: | 13213100 | | Area Units: | km2 | | Discharge Units: | m3/sec | | Starting Year: | 1974 | | Ending Year: | 1992 | | Total Years: | 19 | | Total Usable Years: | 15 | |
| |
| Year | Jan | Feb | Mar | Apr | May | Jun | Jul | Aug | Sep | Oct | Nov | Dec | Avg Annual |
|---|
| 1974 | -9999 | -9999 | -9999 | -9999 | -9999 | -9999 | -9999 | -9999 | -9999 | -9999 | 387.38 | 424.94 | -9999 |
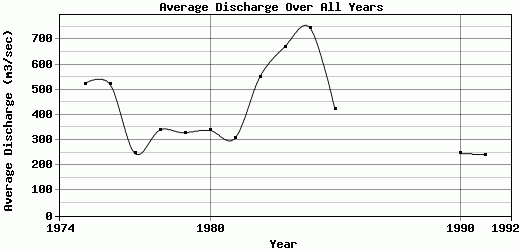
| 1975 | 457.64 | 481.59 | 632.47 | 1009.88 | 1024.98 | 574.65 | 240.93 | 244.2 | 291.54 | 400.09 | 432.02 | 504.13 | 524.51 |
| 1976 | 553.46 | 561.46 | 700.98 | 1034.51 | 843.76 | 501.65 | 207.78 | 283.14 | 346.71 | 401.92 | 397.29 | 425.58 | 521.52 |
| 1977 | 366.84 | 343.95 | 315.31 | 213.95 | 194.88 | 196.27 | 159.53 | 177.56 | 216.09 | 252.65 | 255.34 | 266.63 | 246.58 |
| 1978 | 281.11 | 295.85 | 352.41 | 552.46 | 498.01 | 244.12 | 209.85 | 231.96 | 332.05 | 326.89 | 378.5 | 376.1 | 339.94 |
| 1979 | 438.09 | 458.43 | 545.51 | 480.45 | 255.38 | 212.89 | 176.53 | 258.4 | 276.2 | 295.48 | 283.93 | 268 | 329.11 |
| 1980 | 292.65 | 275.42 | 269.67 | 336.69 | 530.99 | 640.65 | 201.12 | 215.99 | 313.46 | 298.93 | 338.1 | 343.82 | 338.12 |
| 1981 | 327.11 | 293.81 | 322.75 | 391.03 | 283.53 | 468.19 | 183.66 | 200.94 | 272.31 | 332.95 | 299.12 | 304.72 | 306.68 |
| 1982 | 307.71 | 564.01 | 688.29 | 1027.25 | 886.23 | 476.29 | 368.46 | 271.81 | 351.13 | 458.46 | 578.23 | 624.25 | 550.18 |
| 1983 | 666.55 | 641.68 | 842.75 | 896.33 | 1168.12 | 870.94 | 466.77 | 310.94 | 340.75 | 540.12 | 618.44 | 688.56 | 671 |
| 1984 | 857.82 | 599.44 | 687.83 | 1245 | 1389.36 | 1163.73 | 423.38 | 329.31 | 386.53 | 604.89 | 698.3 | 556.02 | 745.13 |
| 1985 | 604.25 | 598.2 | 505.05 | 687.35 | 416.03 | 271.66 | 217.75 | 256.16 | 368.97 | 356.98 | 368.5 | 417.72 | 422.39 |
| 1986 | 432.34 | 755.76 | 1132.86 | 1061.79 | 897.92 | 724.35 | 271.48 | 266.58 | 376.05 | -9999 | -9999 | -9999 | -9999 |
| 1987 | -9999 | -9999 | -9999 | -9999 | -9999 | -9999 | -9999 | -9999 | -9999 | -9999 | -9999 | -9999 | -9999 |
| 1988 | -9999 | -9999 | -9999 | -9999 | -9999 | -9999 | -9999 | -9999 | -9999 | -9999 | -9999 | -9999 | -9999 |
| 1989 | -9999 | -9999 | -9999 | -9999 | -9999 | -9999 | -9999 | -9999 | -9999 | 321.87 | 299.06 | 283.91 | -9999 |
| 1990 | 261.12 | 254.79 | 263.75 | 231.98 | 234.4 | 240.68 | 184.86 | 213.09 | 250.38 | 290.36 | 281.86 | 263.02 | 247.52 |
| 1991 | 270.46 | 252.38 | 227.06 | 212.64 | 242.52 | 217.23 | 196.36 | 202.56 | 260.79 | 273.31 | 275.7 | 263.64 | 241.22 |
| 1992 | 254.43 | 242.46 | 233.44 | 170.84 | 151.99 | 147.91 | 157.04 | 143.72 | 188.7 | -9999 | -9999 | -9999 | -9999 |
| |
|
|
|
|
|
|
|
|
|
|
|
|
|
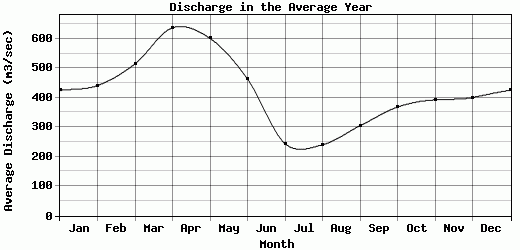
| Avg | 424.77 | 441.28 | 514.68 | 636.81 | 601.21 | 463.41 | 244.37 | 240.42 | 304.78 | 368.21 | 392.78 | 400.74 | 421.84 |
| |
|
|
|
|
|
|
|
|
|
|
|
|
|
| Std Dev | 171.34 |
165.33 |
256.55 |
364.42 |
387.36 |
282.7 |
93.71 |
48.07 |
57.84 |
99.86 |
131.23 |
133.96 |
160.01 |
| |
|
|
|
|
|
|
|
|
|
|
|
|
|
| | Jan | Feb | Mar | Apr | May | Jun | Jul | Aug | Sep | Oct | Nov | Dec | Avg Annual |
Click here for this table in tab-delimited format.
Tab-delimited format will open in most table browsing software, i.e. Excel, etc.
View this station on the map.
Return to start.