Results
| Country: | U.S.A.
| | Station: | PINE CREEK AT OXBOW OR | | River: | SNAKE RIVER | | Area: | 189447.27 | | Lat: | 44.97 | | Lon: | -116.85 | | Source: | USGS | | PointID: | 13290200 | | Area Units: | km2 | | Discharge Units: | m3/sec | | Starting Year: | 1958 | | Ending Year: | 1967 | | Total Years: | 10 | | Total Usable Years: | 10 | |
| |
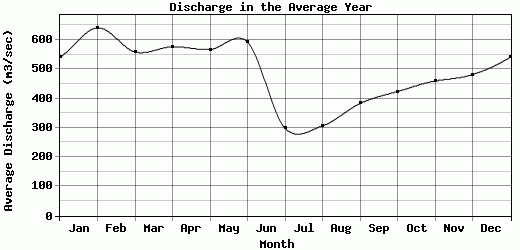
| Year | Jan | Feb | Mar | Apr | May | Jun | Jul | Aug | Sep | Oct | Nov | Dec | Avg Annual |
|---|
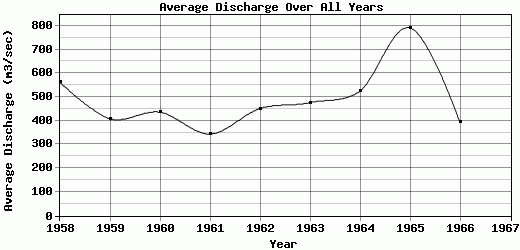
| 1958 | 439.54 | 732.5 | 706.46 | 1064.44 | 1007.98 | 802.17 | 235.58 | 241.36 | 405.92 | 359.42 | 381.15 | 359.08 | 561.3 |
| 1959 | 414.62 | 482.7 | 475.36 | 466.89 | 287.66 | 424.35 | 302.93 | 308.07 | 449.77 | 486.41 | 391.44 | 409.41 | 408.3 |
| 1960 | 467.5 | 481.97 | 512.81 | 490.83 | 541.04 | 515.94 | 263.8 | 340.04 | 370.3 | 378.49 | 413.52 | 450.79 | 435.59 |
| 1961 | 506.05 | 498.88 | 460.93 | 329.46 | 201.47 | 319.5 | 190.4 | 237.33 | 310.04 | 346.63 | 340.84 | 383.92 | 343.79 |
| 1962 | 463.03 | 529.94 | 486.96 | 612.21 | 559.95 | 420.5 | 259.57 | 322.17 | 364.82 | 477.19 | 442.22 | 474.45 | 451.08 |
| 1963 | 525.78 | 526.19 | 391.9 | 381.76 | 623.8 | 990.62 | 303.83 | 302.74 | 393.96 | 384.24 | 394.14 | 497.1 | 476.34 |
| 1964 | 552.36 | 474.94 | 460.11 | 547.18 | 703.01 | 870.89 | 334.52 | 320.79 | 392 | 412.61 | 452.79 | 769.77 | 524.25 |
| 1965 | 818.64 | 1594.35 | 1177.9 | 1146.27 | 1095.59 | 656.2 | 472.8 | 430.29 | 446.84 | 587.99 | 501.02 | 564.7 | 791.05 |
| 1966 | 705.64 | 567.15 | 477.64 | 350.96 | 221.14 | 323.58 | 260 | 280.58 | 334.54 | 381.27 | 395.78 | 424.75 | 393.59 |
| 1967 | 514 | 523.36 | 438.6 | 376.71 | 431.22 | 602.55 | 359.46 | 281.1 | 363.09 | 424.15 | 886.32 | -9999 | -9999 |
| |
|
|
|
|
|
|
|
|
|
|
|
|
|
| Avg | 540.72 | 641.2 | 558.87 | 576.67 | 567.29 | 592.63 | 298.29 | 306.45 | 383.13 | 423.84 | 459.92 | 481.55 | 487.25 |
| |
|
|
|
|
|
|
|
|
|
|
|
|
|
| Std Dev | 120.1 |
325.6 |
220.8 |
278.2 |
290.86 |
222.42 |
74.36 |
52.21 |
42.21 |
70.27 |
148.17 |
117.47 |
124.2 |
| |
|
|
|
|
|
|
|
|
|
|
|
|
|
| | Jan | Feb | Mar | Apr | May | Jun | Jul | Aug | Sep | Oct | Nov | Dec | Avg Annual |
Click here for this table in tab-delimited format.
Tab-delimited format will open in most table browsing software, i.e. Excel, etc.
View this station on the map.
Return to start.