Results
| Country: | U.S.A.
| | Station: | MCNARY DAM,NEAR UMATILLA,OREG. | | River: | COLUMBIA RIVER | | Area: | 554227.15 | | Lat: | 45.93 | | Lon: | -119.29 | | Source: | USGS | | PointID: | 14019200 | | Area Units: | km2 | | Discharge Units: | m3/sec | | Starting Year: | 1950 | | Ending Year: | 1981 | | Total Years: | 32 | | Total Usable Years: | 31 | |
| |
| Year | Jan | Feb | Mar | Apr | May | Jun | Jul | Aug | Sep | Oct | Nov | Dec | Avg Annual |
|---|
| 1950 | -9999 | -9999 | -9999 | -9999 | -9999 | -9999 | -9999 | -9999 | -9999 | 2933.28 | 3563.22 | 3734.19 | -9999 |
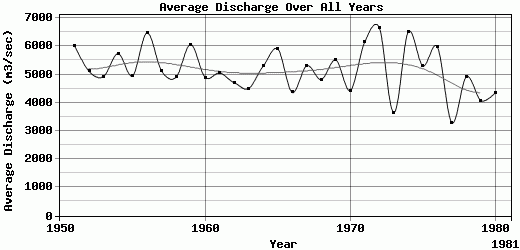
| 1951 | 4024.67 | 5000.98 | 4324.28 | 6724.34 | 12889.7 | 12676.6 | 9521.82 | 4836.73 | 2935.81 | 3285.69 | 2966.58 | 3060.52 | 6020.64 |
| 1952 | 3229.97 | 3423.43 | 3911.4 | 6686.59 | 12719.8 | 11105 | 7239.1 | 3849.28 | 2536.07 | 2292.12 | 2242.05 | 2130.08 | 5113.74 |
| 1953 | 2826.04 | 3577.04 | 3605.39 | 4084.26 | 6798.82 | 13934.8 | 8755.43 | 4267.65 | 3174.15 | 2676.23 | 2734.29 | 2717.61 | 4929.31 |
| 1954 | 2966.98 | 3181.62 | 3435.49 | 4226.78 | 10558.6 | 13995.2 | 11747 | 5891.76 | 4137.11 | 2938.39 | 3025.39 | 2748.67 | 5737.75 |
| 1955 | 2720.26 | 2910.08 | 3210.78 | 3795.42 | 5427.73 | 12518 | 11078.3 | 4897.01 | 3004.91 | 2734.97 | 3306.48 | 3867.19 | 4955.93 |
| 1956 | 3787.17 | 3347.26 | 4377.26 | 9253.05 | 14591.5 | 17667.9 | 8441.21 | 4299.62 | 3058.24 | 2968.26 | 2943.93 | 2939.21 | 6472.88 |
| 1957 | 2994.84 | 3229.65 | 3820.06 | 4891.29 | 14422.5 | 12940.9 | 5579.36 | 3367.9 | 2558.35 | 2640.15 | 2522.95 | 2511.08 | 5123.25 |
| 1958 | 2583.97 | 3646.72 | 3924.19 | 5451.97 | 10697.4 | 12195.2 | 5461.53 | 3265.32 | 2596.39 | 2663.81 | 2949.31 | 3400.78 | 4903.05 |
| 1959 | 3874.95 | 3822.8 | 4242.98 | 5642.63 | 9485.28 | 14136.8 | 9686.24 | 4529.81 | 4223.95 | 4796.53 | 4443.88 | 3861.16 | 6062.25 |
| 1960 | 3176.8 | 3310.94 | 3496.88 | 7037.72 | 8251.21 | 10703.8 | 7941.55 | 4145.15 | 2792.62 | 2598.59 | 2795.55 | 2498.66 | 4895.79 |
| 1961 | 2696.87 | 4309.24 | 4251.2 | 4694.01 | 9179.28 | 16206.8 | 6212.38 | 3336.2 | 2501.9 | 2500.39 | 2424.12 | 2340.9 | 5054.44 |
| 1962 | 2889.7 | 3383.38 | 2902.68 | 5764.4 | 8112.36 | 10487.7 | 6458.1 | 4253.94 | 2614.04 | 2916.38 | 3106.37 | 3629.14 | 4709.85 |
| 1963 | 3402.61 | 4195.97 | 3423.62 | 4411.79 | 7020.79 | 10840.7 | 6887.43 | 3766.16 | 2704.18 | 2459.19 | 2393.92 | 2535.92 | 4503.52 |
| 1964 | 2551 | 2924.46 | 2808.59 | 3696.31 | 8043.86 | 16084.1 | 9769.37 | 4462.21 | 2896.64 | 3322.22 | 2935.81 | 4039.19 | 5294.48 |
| 1965 | 4393.7 | 5998.15 | 4900.67 | 6605.41 | 11086.6 | 13264.6 | 8019.19 | 4599.23 | 3117.98 | 2889.25 | 2912.31 | 3080.43 | 5905.63 |
| 1966 | 3106.28 | 3274.05 | 3446 | 3973.82 | 7313.09 | 9380.48 | 7192.52 | 3694.36 | 2666.05 | 2604.98 | 2664.06 | 3062.25 | 4364.83 |
| 1967 | 3351.73 | 3427.17 | 3648.69 | 3909.63 | 7028.1 | 16020.8 | 9594.9 | 4232.94 | 2957.33 | 2920.94 | 3094.95 | 3559.9 | 5312.26 |
| 1968 | 3373.74 | 4014.18 | 4644.9 | 4309.38 | 5695.37 | 10423.5 | 7455.59 | 3996.44 | 3451.28 | 3199 | 3501.4 | 3782.51 | 4820.61 |
| 1969 | 4682.35 | 4813.89 | 5072.4 | 8943.45 | 10803.4 | 9287.98 | 6385.94 | 3433.66 | 2782.9 | 3110.76 | 3295.91 | 3542 | 5512.89 |
| 1970 | 3963.38 | 3733.8 | 3749.35 | 4046.59 | 7150.96 | 9514.51 | 5030.38 | 3493.95 | 2929.3 | 3013.75 | 3162.25 | 3410.55 | 4433.23 |
| 1971 | 3867.19 | 5281.12 | 5816.86 | 6845.16 | 13084.3 | 13358.1 | 7881.26 | 4487.24 | 2910.42 | 3036.4 | 3360.94 | 3905.1 | 6152.84 |
| 1972 | 4110.71 | 4912.8 | 8521.59 | 7841.92 | 11071 | 15565.9 | 8352.6 | 5067.83 | 3469.21 | 3277.46 | 3421.26 | 4226.08 | 6653.2 |
| 1973 | 4125.15 | 3811.06 | 3971.69 | 3789.29 | 4000.92 | 3951.17 | 3715.65 | 3436.04 | 2762.23 | 2902.4 | 3060.97 | 4274.13 | 3650.06 |
| 1974 | 6612.48 | 6433.02 | 6035.17 | 8221.37 | 9717.3 | 13430.8 | 8305.1 | 4695.05 | 3756.44 | 3541.91 | 3654.97 | 3727.8 | 6510.95 |
| 1975 | 4280.43 | 4870.52 | 5845.18 | 5691.72 | 8379.09 | 9276.65 | 5703.59 | 3723.68 | 3010.66 | 3293.45 | 4130.51 | 5436.86 | 5303.53 |
| 1976 | 5437.78 | 5871.38 | 6011.42 | 7240.66 | 9830.57 | 8323.31 | 6748.58 | 6387.77 | 4593.96 | 3854.22 | 3682.15 | 3716.38 | 5974.85 |
| 1977 | 4094.09 | 3530.62 | 3457.14 | 2880.5 | 3863.08 | 3412.48 | 2585.62 | 2704.91 | 2857.47 | 2638.14 | 3283.36 | 4190.82 | 3291.52 |
| 1978 | 4496.01 | 4619.72 | 4880.57 | 6520.46 | 7369.73 | 6825.34 | 5237.73 | 3544.19 | 4045.93 | 3557.89 | 3965.14 | 4014.62 | 4923.11 |
| 1979 | 4553.56 | 4366.89 | 4410.14 | 4577.92 | 6547.62 | 4965.86 | 3430.56 | 3074.04 | 2699.74 | 2949.35 | 3714.91 | 3644.58 | 4077.93 |
| 1980 | 4157.48 | 3827.38 | 3663.58 | 4071.14 | 6991.56 | 8044.86 | 4490.53 | 3300.67 | 2891.17 | 2763.28 | 3434.47 | 4686.92 | 4360.25 |
| 1981 | 5734.65 | 5270 | 4209.18 | 4253.21 | 6665.46 | 10097.8 | 6402.38 | 4552.37 | 3150.64 | -9999 | -9999 | -9999 | -9999 |
| |
|
|
|
|
|
|
|
|
|
|
|
|
|
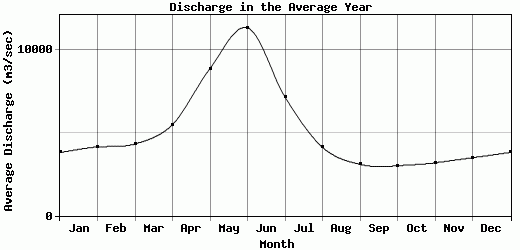
| Avg | 3808.6 | 4139.33 | 4323.2 | 5486.52 | 8864.42 | 11310.9 | 7139.06 | 4115.91 | 3089.91 | 3009.01 | 3183.66 | 3492.75 | 5167.49 |
| |
|
|
|
|
|
|
|
|
|
|
|
|
|
| Std Dev | 942.32 |
928.81 |
1151.27 |
1665.04 |
2777.82 |
3519.84 |
2142.71 |
791.94 |
530.05 |
474.28 |
500.87 |
723.42 |
813.42 |
| |
|
|
|
|
|
|
|
|
|
|
|
|
|
| | Jan | Feb | Mar | Apr | May | Jun | Jul | Aug | Sep | Oct | Nov | Dec | Avg Annual |
Click here for this table in tab-delimited format.
Tab-delimited format will open in most table browsing software, i.e. Excel, etc.
View this station on the map.
Return to start.