Results
| Country: | U.S.A.
| | Station: | SHERARS BRIDGE,OREG. | | River: | DESCHUTES RIVER | | Area: | 26416.43 | | Lat: | 45.25 | | Lon: | -121.04 | | Source: | USGS | | PointID: | 14102000 | | Area Units: | km2 | | Discharge Units: | m3/sec | | Starting Year: | 1923 | | Ending Year: | 1932 | | Total Years: | 10 | | Total Usable Years: | 8 | |
| |
| Year | Jan | Feb | Mar | Apr | May | Jun | Jul | Aug | Sep | Oct | Nov | Dec | Avg Annual |
|---|
| 1923 | -9999 | -9999 | -9999 | -9999 | -9999 | 149.6 | 140.36 | 124.58 | 120.92 | 112.55 | 154.11 | -9999 | -9999 |
| 1924 | -9999 | -9999 | -9999 | -9999 | -9999 | -9999 | 109.54 | 109.6 | 109.21 | -9999 | -9999 | -9999 | -9999 |
| 1925 | -9999 | -9999 | -9999 | -9999 | -9999 | -9999 | -9999 | -9999 | -9999 | 123.54 | 136.13 | 145.38 | -9999 |
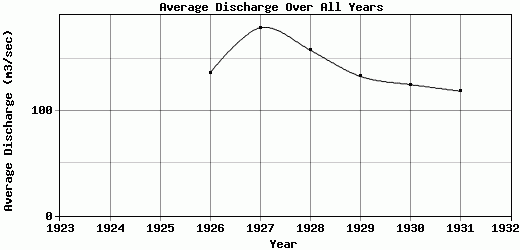
| 1926 | 146 | 196.98 | 170.17 | 148.08 | 118.44 | 110.1 | 106.56 | 105.69 | 106.19 | 115.85 | 147 | 169.36 | 136.7 |
| 1927 | 165.67 | 265.36 | 234.26 | 228.81 | 207.2 | 173.77 | 127.39 | 116.4 | 132.35 | 141.45 | 180.57 | 185.81 | 179.92 |
| 1928 | 204.41 | 173.16 | 255.37 | 212.82 | 175.83 | 132.71 | 118.86 | 112.35 | 113.33 | 122.21 | 141.56 | 141.27 | 158.66 |
| 1929 | 141.15 | 140.84 | 169.23 | 156.45 | 157.96 | 136.69 | 113.54 | 105.67 | 104.71 | 107.5 | 121.33 | 147.22 | 133.52 |
| 1930 | 132.42 | 194.32 | 157.7 | 136.54 | 118.39 | 110.19 | 104.47 | 101.46 | 101.71 | 104.64 | 123.13 | 122.13 | 125.59 |
| 1931 | 123.72 | 125.45 | 138.32 | 169.22 | 127.81 | 108.7 | 102.25 | 98.76 | 98.68 | 101.16 | 115.13 | 121.94 | 119.26 |
| 1932 | 133.37 | 139.14 | 205.72 | 193.23 | 172.76 | 137.36 | 115.57 | 106.54 | 105.09 | -9999 | -9999 | -9999 | -9999 |
| |
|
|
|
|
|
|
|
|
|
|
|
|
|
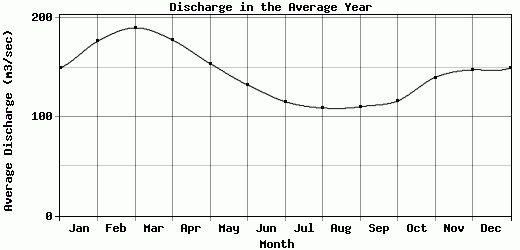
| Avg | 149.53 | 176.46 | 190.11 | 177.88 | 154.06 | 132.39 | 115.39 | 109.01 | 110.24 | 116.11 | 139.87 | 147.59 | 142.28 |
| |
|
|
|
|
|
|
|
|
|
|
|
|
|
| Std Dev | 25.57 |
44.59 |
39.67 |
32.03 |
31.38 |
21.22 |
11.48 |
7.45 |
9.96 |
12.13 |
19.88 |
21.67 |
20.82 |
| |
|
|
|
|
|
|
|
|
|
|
|
|
|
| | Jan | Feb | Mar | Apr | May | Jun | Jul | Aug | Sep | Oct | Nov | Dec | Avg Annual |
Click here for this table in tab-delimited format.
Tab-delimited format will open in most table browsing software, i.e. Excel, etc.
View this station on the map.
Return to start.