Results
| Country: | U.S.A.
| | Station: | PORTLAND,OREG. | | River: | WILLAMETTE RIVER | | Area: | 28747.30 | | Lat: | 45.52 | | Lon: | -122.67 | | Source: | USGS | | PointID: | 14211720 | | Area Units: | km2 | | Discharge Units: | m3/sec | | Starting Year: | 1972 | | Ending Year: | 1993 | | Total Years: | 22 | | Total Usable Years: | 21 | |
| |
| Year | Jan | Feb | Mar | Apr | May | Jun | Jul | Aug | Sep | Oct | Nov | Dec | Avg Annual |
|---|
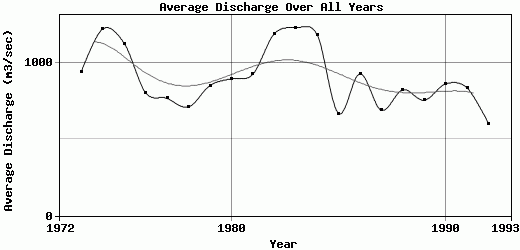
| 1972 | -9999 | -9999 | -9999 | -9999 | -9999 | -9999 | -9999 | -9999 | -9999 | 383.47 | 677.91 | 1602.83 | -9999 |
| 1973 | 1631.33 | 525.99 | 704.18 | 546.14 | 315.7 | 236.47 | 185.23 | 173.75 | 242.95 | 383.33 | 2786.58 | 3576.16 | 942.32 |
| 1974 | 3375.93 | 2051.06 | 2202.88 | 1663.91 | 861.29 | 829.59 | 334.55 | 215.2 | 263.66 | 422.47 | 636.19 | 1811.37 | 1222.34 |
| 1975 | 2571.55 | 1701.24 | 1649.42 | 802.22 | 915.64 | 488 | 298.99 | 262.52 | 386.9 | 627.27 | 1297.96 | 2526.33 | 1127.34 |
| 1976 | 2750.68 | 1248.39 | 1246.13 | 1216.97 | 784.02 | 449.96 | 268.21 | 268.39 | 349.27 | 401.1 | 412.11 | 251.86 | 803.92 |
| 1977 | 249.03 | 227.94 | 828.41 | 499.13 | 630.83 | 377.12 | 210.08 | 224.01 | 333.7 | 434.16 | 1536.1 | 3659.1 | 767.47 |
| 1978 | 1965.38 | 1200.64 | 509.25 | 616.18 | 664.81 | 324.89 | 220.87 | 247.27 | 491.21 | 428.77 | 499.61 | 1368.62 | 711.46 |
| 1979 | 790.14 | 2000.49 | 1368.72 | 1119.47 | 983.6 | 319.7 | 240.79 | 224.53 | 319.13 | 505.05 | 842.81 | 1505 | 851.62 |
| 1980 | 2570.27 | 974.69 | 1096.87 | 968.72 | 433.89 | 396.44 | 226.54 | 213.75 | 317.15 | 334.32 | 695.65 | 2516.56 | 895.4 |
| 1981 | 951.82 | 1226.73 | 656.77 | 938.24 | 532.54 | 763.62 | 270.38 | 251.2 | 339.8 | 583.7 | 1119.47 | 3463.81 | 924.84 |
| 1982 | 2346.66 | 2662.81 | 1443.25 | 1369.6 | 687.83 | 445.52 | 287.74 | 255.77 | 332.25 | 615.67 | 1003.37 | 2822.56 | 1189.42 |
| 1983 | 2189.54 | 2534.37 | 2021.47 | 1383.76 | 717.06 | 474.78 | 449.42 | 307.83 | 394.55 | 421.1 | 1739.61 | 2115.55 | 1229.09 |
| 1984 | 1581.18 | 1698.04 | 1502.63 | 1219.52 | 1175.61 | 1096.81 | 340.72 | 242.98 | 399.27 | 616.67 | 2635.37 | 1703.22 | 1184.33 |
| 1985 | 756.89 | 902.5 | 748.39 | 943.33 | 580.22 | 617.97 | 232.07 | 239.46 | 367.18 | 588.17 | 1056.98 | 984.43 | 668.13 |
| 1986 | 1540.63 | 2603.24 | 1532.68 | 548.5 | 676.14 | 307.01 | 230.3 | 217.73 | 377.17 | 445.12 | 1450.21 | 1206.21 | 927.91 |
| 1987 | 1473.31 | 1754.34 | 1261.02 | 532.08 | 336.43 | 241.86 | 217.61 | 204.23 | 243.3 | 252.46 | 291.8 | 1469.29 | 689.81 |
| 1988 | 1885 | 873.53 | 822.47 | 1089.07 | 938.66 | 750.78 | 261.11 | 219.41 | 275.12 | 354.15 | 1354.4 | 1065.72 | 824.12 |
| 1989 | 1802.24 | 1008.69 | 1790.55 | 1152.97 | 527.34 | 351.58 | 213.78 | 225.96 | 293.88 | 387.12 | 603.06 | 703.42 | 755.05 |
| 1990 | 1748.16 | 1866.49 | 1037.13 | 751.06 | 700.07 | 652.23 | 256.49 | 223.06 | 266.26 | 453.35 | 1220.56 | 1175.16 | 862.5 |
| 1991 | 1239.28 | 1077.46 | 1187.03 | 1094.92 | 997.22 | 441.65 | 249.56 | 216.94 | 285.98 | 373.4 | 1246.14 | 1622.75 | 836.03 |
| 1992 | 883.49 | 1207.67 | 524.78 | 724.67 | 396.34 | 201.76 | 195.41 | 207.13 | 217.59 | 271.29 | 808.26 | 1581.46 | 601.65 |
| 1993 | 1346.25 | 743.52 | 1812.74 | 2040.52 | 1323.32 | 1065.47 | 385.84 | 335.69 | 360.85 | -9999 | -9999 | -9999 | -9999 |
| |
|
|
|
|
|
|
|
|
|
|
|
|
|
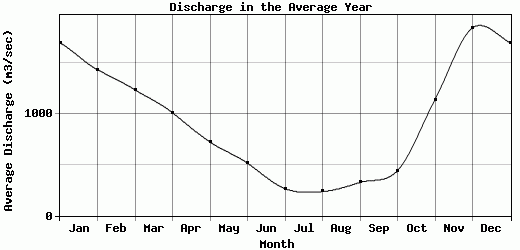
| Avg | 1697.56 | 1432.85 | 1235.56 | 1010.52 | 722.79 | 515.87 | 265.51 | 236.99 | 326.53 | 442.01 | 1138.77 | 1844.35 | 900.74 |
| |
|
|
|
|
|
|
|
|
|
|
|
|
|
| Std Dev | 746 |
664.58 |
481.66 |
388.33 |
261.07 |
251.82 |
64.22 |
35.05 |
63.89 |
107.4 |
635.67 |
914.97 |
189.16 |
| |
|
|
|
|
|
|
|
|
|
|
|
|
|
| | Jan | Feb | Mar | Apr | May | Jun | Jul | Aug | Sep | Oct | Nov | Dec | Avg Annual |
Click here for this table in tab-delimited format.
Tab-delimited format will open in most table browsing software, i.e. Excel, etc.
View this station on the map.
Return to start.