Results
| Country: | Brasil
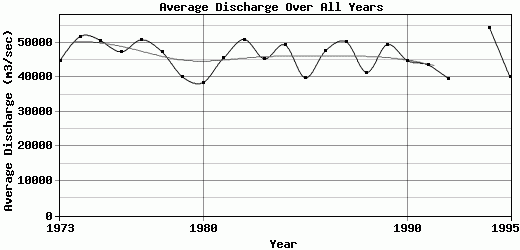
| | Station: | Sao Paulo de Olivenca | | River: | Solimoes | | Area: | 990781 km2 | | Lat: | -3.47 | | Lon: | -68.75 | | Source: | ANEEL | | PointID: | 3 | | Area Units: | km2 | | Discharge Units: | m3/sec | | Starting Year: | 1973 | | Ending Year: | 1995 | | Total Years: | 23 | | Total Usable Years: | 22 | |
| |
| Year | Jan | Feb | Mar | Apr | May | Jun | Jul | Aug | Sep | Oct | Nov | Dec | Avg Annual |
|---|
| 1973 | 45769 | 50006 | 48809 | 56578 | 52395 | 46121 | 34414 | 46175 | 36445 | 34657 | 39195 | 47345 | 44825.8 |
| 1974 | 50555 | 49445 | 59471 | 65198 | 69819 | 64805 | 56941 | 43408 | 31830 | 40541 | 43767 | 46456 | 51853 |
| 1975 | 51163 | 52610 | 56742 | 65972 | 69498 | 68809 | 65189 | 40715 | 33595 | 30218 | 34310 | 37986 | 50567.2 |
| 1976 | 43416 | 51199 | 50363 | 63262 | 69569 | 65888 | 51548 | 32483 | 30488 | 29795 | 37076 | 43319 | 47367.2 |
| 1977 | 43710 | 38991 | 60519 | 72617 | 74373 | 62720 | 45791 | 36390 | 29933 | 41425 | 48644 | 55420 | 50877.8 |
| 1978 | 40557 | 48372 | 45378 | 61045 | 68222 | 60662 | 46572 | 38198 | 27885 | 43296 | 40194 | 47183 | 47297 |
| 1979 | 44776 | 31774 | 44039 | 59044 | 65515 | 56494 | 32257 | 28123 | 24020 | 27110 | 25967 | 41972 | 40090.9 |
| 1980 | 39708 | 39926 | 33507 | 52624 | 51860 | 43016 | 37837 | 24926 | 19618 | 30575 | 43132 | 45171 | 38491.7 |
| 1981 | 39725 | 45293 | 60434 | 62121 | 66739 | 60858 | 52965 | 38180 | 23831 | 24203 | 29994 | 42355 | 45558.2 |
| 1982 | 53740 | 51547 | 55869 | 64664 | 74634 | 68147 | 44778 | 36880 | 28236 | 32379 | 44188 | 56733 | 50982.9 |
| 1983 | 64473 | 61388 | 56345 | 60933 | 65606 | 54857 | 28876 | 20707 | 23323 | 25576 | 36610 | 45593 | 45357.2 |
| 1984 | 45905 | 53344 | 65402 | 67168 | 70734 | 63041 | 50202 | 32473 | 30984 | 31447 | 33871 | 48138 | 49392.4 |
| 1985 | 47185 | 32666 | 41318 | 46681 | 49737 | 46394 | 40965 | 32174 | 28110 | 36935 | 35600 | 40573 | 39861.5 |
| 1986 | 33456 | 43272 | 50381 | 64034 | 72076 | 65785 | 43221 | 29929 | 31216 | 41760 | 49700 | 48464 | 47774.5 |
| 1987 | 57090 | 66488 | 72467 | 72675 | 68877 | 51609 | 36999 | 30648 | 25041 | 28383 | 43820 | 48778 | 50239.6 |
| 1988 | 45427 | 53538 | 55965 | 54920 | 62975 | 54452 | 32425 | 18907 | 15272 | 26951 | 37712 | 38538 | 41423.5 |
| 1989 | 43161 | 57214 | 60755 | 67244 | 70409 | 68780 | 63259 | 38618 | 24974 | 32367 | 38579 | 28387 | 49478.9 |
| 1990 | 31778 | 56109 | 58396 | 63192 | 56380 | 48502 | 50640 | 32856 | 26996 | 23047 | 38417 | 51275 | 44799 |
| 1991 | 53296 | 44822 | 55444 | 62087 | 66302 | 60706 | 42507 | 24491 | 17445 | 24342 | 33828 | 37901 | 43597.6 |
| 1992 | 38247 | 28101 | 47543 | 56764 | 53856 | 39936 | 35348 | 24540 | 33336 | 33690 | 35469 | 48174 | 39583.7 |
| 1993 | 55815 | 58704 | 64066 | 73221 | 77984 | 68705 | 44184 | 34822 | 35182 | -9999 | -9999 | -9999 | -9999 |
| 1994 | 57351 | 54275 | 62317 | 69013 | 77695 | 78410 | 67121 | 39120 | 27712 | 33459 | 37138 | 48239 | 54320.8 |
| 1995 | 44641 | 45671 | 49114 | 58988 | 55239 | 50513 | 37323 | 25915 | 19120 | 20288 | 33079 | 41135 | 40085.5 |
| |
|
|
|
|
|
|
|
|
|
|
|
|
|
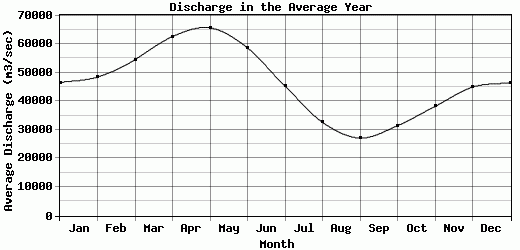
| Avg | 46562.8 | 48467.6 | 54549.7 | 62610.6 | 65673.6 | 58661.3 | 45276.6 | 32638.2 | 27156.2 | 31474.7 | 38195 | 44960.7 | 46083 |
| |
|
|
|
|
|
|
|
|
|
|
|
|
|
| Std Dev | 7791.07 |
9362.52 |
8620.03 |
6382.91 |
8261.1 |
9634.62 |
10479.4 |
7041 |
5543.67 |
6274.54 |
5579.23 |
6127.06 |
4554.61 |
| |
|
|
|
|
|
|
|
|
|
|
|
|
|
| | Jan | Feb | Mar | Apr | May | Jun | Jul | Aug | Sep | Oct | Nov | Dec | Avg Annual |
Click here for this table in tab-delimited format.
Tab-delimited format will open in most table browsing software, i.e. Excel, etc.
View this station on the map.
Return to start.