Results
| Country: | Brasil
| | Station: | Santo Antonio do Ica | | River: | Solimoes | | Area: | 1134540 km2 | | Lat: | -3.08 | | Lon: | -67.93 | | Source: | ANEEL | | PointID: | 5 | | Area Units: | km2 | | Discharge Units: | m3/sec | | Starting Year: | 1973 | | Ending Year: | 1995 | | Total Years: | 23 | | Total Usable Years: | 22 | |
| |
| Year | Jan | Feb | Mar | Apr | May | Jun | Jul | Aug | Sep | Oct | Nov | Dec | Avg Annual |
|---|
| 1973 | 6809 | 6395 | 8198 | 10629 | 11215 | 9643 | 8280 | 56993 | 46330 | 43234 | 46967 | 56570 | 25938.6 |
| 1974 | 59808 | 58387 | 70087 | 76687 | 80232 | 77321 | 70901 | 56444 | 40538 | 49100 | 52810 | 55247 | 62296.8 |
| 1975 | 60685 | 63520 | 67462 | 76964 | 80118 | 81116 | 79262 | 55487 | 41947 | 37180 | 40541 | 45685 | 60830.6 |
| 1976 | 50933 | 60296 | 59666 | 73778 | 79171 | 78542 | 66107 | 44059 | 38627 | 36304 | 43303 | 51264 | 56837.5 |
| 1977 | 51963 | 43842 | 68769 | 80183 | 82556 | 75077 | 57584 | 46524 | 38132 | 48795 | 57664 | 64889 | 59664.8 |
| 1978 | 50065 | 55387 | 52137 | 69884 | 77859 | 73825 | 58351 | 49151 | 33105 | 50668 | 48078 | 53799 | 56025.8 |
| 1979 | 53156 | 36032 | 49593 | 67181 | 75015 | 69445 | 42520 | 35393 | 29911 | 32628 | 30685 | 48384 | 47495.2 |
| 1980 | 46403 | 45446 | 37813 | 60492 | 62120 | 52950 | 46919 | 32775 | 23471 | 35639 | 50733 | 52367 | 45594 |
| 1981 | 45963 | 50969 | 69376 | 71465 | 76246 | 72797 | 65397 | 40961 | 26307 | 29210 | 34342 | 48369 | 52616.8 |
| 1982 | 62997 | 60488 | 65592 | 73735 | 82676 | 80499 | 59147 | 46516 | 35575 | 37789 | 50295 | 64949 | 60021.5 |
| 1983 | 72968 | 69879 | 65159 | 69741 | 75124 | 67502 | 36083 | 24716 | 27794 | 30283 | 42408 | 52355 | 52834.3 |
| 1984 | 53751 | 61010 | 74291 | 75261 | 78956 | 73604 | 61413 | 40924 | 36651 | 36988 | 38675 | 54355 | 57156.6 |
| 1985 | 55521 | 36662 | 45581 | 51981 | 57487 | 56053 | 48955 | 41580 | 35423 | 43638 | 42760 | 48758 | 47033.2 |
| 1986 | 40269 | 49354 | 56281 | 70537 | 78754 | 76831 | 58406 | 42434 | 38172 | 51064 | 58965 | 58026 | 56591.1 |
| 1987 | 66006 | 74718 | 80022 | 81146 | 79622 | 66331 | 47543 | 39316 | 34031 | 36911 | 45892 | 57315 | 59071.1 |
| 1988 | 54976 | 62588 | 65168 | 63839 | 72356 | 68746 | 43295 | 23078 | 15126 | 30084 | 42695 | 45047 | 48916.5 |
| 1989 | 47430 | 65786 | 68859 | 76208 | 80049 | 79871 | 77565 | 53824 | 32749 | 38603 | 46688 | 33503 | 58427.9 |
| 1990 | 34172 | 64722 | 68169 | 75669 | 73364 | 60755 | 62732 | 40096 | 32052 | 25998 | 43176 | 58783 | 53307.3 |
| 1991 | 62089 | 51249 | 63047 | 70989 | 76347 | 74479 | 56043 | 32256 | 20355 | 29817 | 39054 | 44060 | 51648.8 |
| 1992 | 46955 | 33587 | 53990 | 66110 | 65677 | 50295 | 44492 | 29837 | 39059 | 37980 | 40230 | 53952 | 46847 |
| 1993 | 64836 | 67500 | 72962 | 80842 | 86156 | 81133 | 57748 | 42803 | 43196 | -9999 | -9999 | -9999 | -9999 |
| 1994 | 67610 | 63008 | 72494 | 79133 | 85801 | 87619 | 80427 | 50307 | 35073 | 40808 | 43094 | 56678 | 63504.3 |
| 1995 | 54805 | 51317 | 55704 | 70474 | 69065 | 66052 | 49432 | 27023 | 18828 | 25692 | 42700 | 53444 | 48711.3 |
| |
|
|
|
|
|
|
|
|
|
|
|
|
|
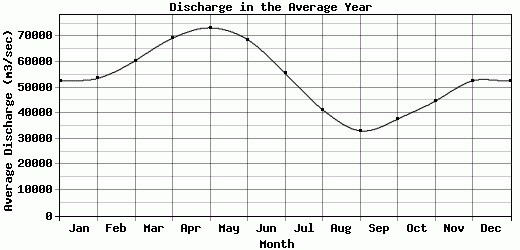
| Avg | 52616.1 | 53571.4 | 60453 | 69257.7 | 73302.9 | 68716.8 | 55591.4 | 41412.9 | 33150.1 | 37655.1 | 44625.2 | 52627.2 | 53244.1 |
| |
|
|
|
|
|
|
|
|
|
|
|
|
|
| Std Dev | 13261.3 |
14801.8 |
14902.7 |
14204.7 |
14924.4 |
15633.5 |
15476.7 |
9733.95 |
7868.73 |
7501.26 |
6605.38 |
6857.93 |
7974.31 |
| |
|
|
|
|
|
|
|
|
|
|
|
|
|
| | Jan | Feb | Mar | Apr | May | Jun | Jul | Aug | Sep | Oct | Nov | Dec | Avg Annual |
Click here for this table in tab-delimited format.
Tab-delimited format will open in most table browsing software, i.e. Excel, etc.
View this station on the map.
Return to start.

