Results
| Country: | Brasil
| | Station: | Itapeua | | River: | Solimoes | | Area: | 1769000 km2 | | Lat: | -4.05 | | Lon: | -63.02 | | Source: | ANEEL | | PointID: | 10 | | Area Units: | km2 | | Discharge Units: | m3/sec | | Starting Year: | 1974 | | Ending Year: | 1984 | | Total Years: | 11 | | Total Usable Years: | 11 | |
| |
| Year | Jan | Feb | Mar | Apr | May | Jun | Jul | Aug | Sep | Oct | Nov | Dec | Avg Annual |
|---|
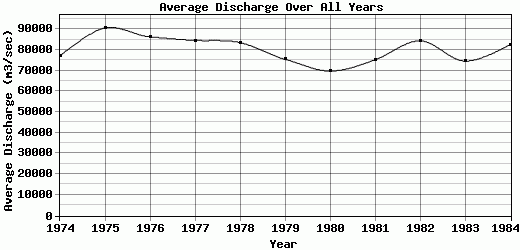
| 1974 | 8739 | 9759 | 86594 | 93450 | 103035 | 109778 | 108513 | 99863 | 83591 | 73416 | 74292 | 74522 | 77129.3 |
| 1975 | 78414 | 85299 | 89845 | 98008 | 107309 | 116871 | 118672 | 107940 | 88357 | 69747 | 61821 | 65802 | 90673.8 |
| 1976 | 71663 | 81812 | 85797 | 98831 | 108668 | 117740 | 112556 | 95858 | 77562 | 61088 | 58717 | 65281 | 86297.8 |
| 1977 | 71219 | 65135 | 79348 | 93236 | 104810 | 110705 | 104710 | 90602 | 71326 | 66895 | 76170 | 80970 | 84593.8 |
| 1978 | 81915 | 75999 | 79706 | 87733 | 100270 | 106684 | 102145 | 90584 | 70474 | 67492 | 69224 | 70571 | 83566.4 |
| 1979 | 78034 | 66571 | 70688 | 87559 | 98655 | 104330 | 96554 | 76292 | 59559 | 52600 | 53060 | 62167 | 75505.8 |
| 1980 | 67225 | 65803 | 59481 | 76875 | 85668 | 87172 | 81980 | 69140 | 53783 | 56667 | 65696 | 68232 | 69810.2 |
| 1981 | 66039 | 69564 | 83644 | 91262 | 95305 | 98307 | 96377 | 83549 | 56207 | 50411 | 52173 | 59081 | 75159.9 |
| 1982 | 75366 | 78781 | 83867 | 92134 | 103451 | 112508 | 107697 | 91036 | 72976 | 60780 | 60373 | 73435 | 84367 |
| 1983 | 81380 | 82455 | 81046 | 86439 | 94413 | 96358 | 83709 | 58871 | 53733 | 51674 | 58731 | 66066 | 74572.9 |
| 1984 | 74880 | 78887 | 90800 | 95663 | 101366 | 105418 | 101315 | 87874 | 69511 | 58534 | 60131 | 66117 | 82541.3 |
| |
|
|
|
|
|
|
|
|
|
|
|
|
|
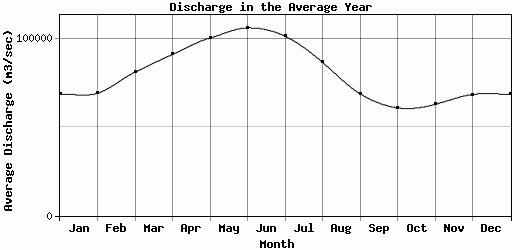
| Avg | 68624.9 | 69096.8 | 80983.3 | 91017.3 | 100268 | 105988 | 101293 | 86509.9 | 68825.4 | 60845.8 | 62762.6 | 68385.8 | 80383.5 |
| |
|
|
|
|
|
|
|
|
|
|
|
|
|
| Std Dev | 19584.7 |
19986.4 |
8621.3 |
5934.23 |
6284.42 |
8764.64 |
10716.3 |
13346.5 |
11288.2 |
7397.03 |
7480.05 |
5865.2 |
6003.6 |
| |
|
|
|
|
|
|
|
|
|
|
|
|
|
| | Jan | Feb | Mar | Apr | May | Jun | Jul | Aug | Sep | Oct | Nov | Dec | Avg Annual |
Click here for this table in tab-delimited format.
Tab-delimited format will open in most table browsing software, i.e. Excel, etc.
View this station on the map.
Return to start.