Results
| Country: | Brasil
| | Station: | Seringal da Caridade | | River: | Purus | | Area: | 63166 km2 | | Lat: | -9.03 | | Lon: | -68.57 | | Source: | ANEEL | | PointID: | 12 | | Area Units: | km2 | | Discharge Units: | m3/sec | | Starting Year: | 1967 | | Ending Year: | 1996 | | Total Years: | 30 | | Total Usable Years: | 29 | |
| |
| Year | Jan | Feb | Mar | Apr | May | Jun | Jul | Aug | Sep | Oct | Nov | Dec | Avg Annual |
|---|
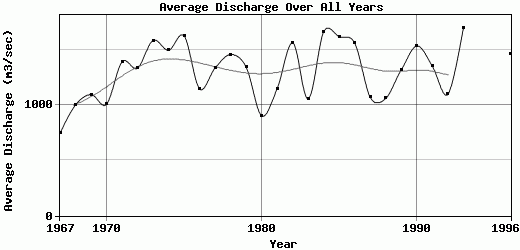
| 1967 | 1825 | 1065 | 1418 | 1753 | 572 | 375 | 200 | 69 | 63 | 99 | 448 | 1073 | 746.67 |
| 1968 | 1179 | 3411 | 2158 | 1577 | 276 | 129 | 93 | 77 | 270 | 413 | 630 | 1823 | 1003 |
| 1969 | 2662 | 3492 | 2267 | 1845 | 609 | 308 | 133 | 76 | 88 | 287 | 343 | 1065 | 1097.92 |
| 1970 | 1629 | 1590 | 2764 | 2951 | 1198 | 338 | 205 | 102 | 108 | 180 | 224 | 824 | 1009.42 |
| 1971 | 1753 | 4960 | 3070 | 3150 | 1180 | 289 | 189 | 100 | 74 | 189 | 667 | 1108 | 1394.08 |
| 1972 | 2558 | 3133 | 3707 | 2646 | 1226 | 405 | 163 | 124 | 147 | 215 | 530 | 1192 | 1337.17 |
| 1973 | 2037 | 3597 | 2851 | 3360 | 1134 | 563 | 551 | 234 | 127 | 415 | 1752 | 2442 | 1588.58 |
| 1974 | 3231 | 5493 | 3940 | 1731 | 515 | 365 | 171 | 106 | 73 | 290 | 436 | 1642 | 1499.42 |
| 1975 | 2832 | 3382 | 5830 | 3276 | 1523 | 443 | 275 | 124 | 140 | 218 | 326 | 1184 | 1629.42 |
| 1976 | 3001 | 3677 | 3350 | 1359 | 371 | 189 | 96 | 76 | 70 | 115 | 380 | 1108 | 1149.33 |
| 1977 | 2714 | 2437 | 3576 | 1227 | 1724 | 284 | 152 | 85 | 87 | 401 | 1574 | 1811 | 1339.33 |
| 1978 | 2173 | 2304 | 2948 | 3024 | 990 | 557 | 215 | 143 | 131 | 395 | 1264 | 3382 | 1460.5 |
| 1979 | 2006 | 2078 | 4390 | 3365 | 1265 | 300 | 146 | 126 | 182 | 220 | 750 | 1322 | 1345.83 |
| 1980 | 1635 | 2227 | 2267 | 1541 | 883 | 458 | 148 | 133 | 125 | 225 | 402 | 812 | 904.67 |
| 1981 | 1284 | 3244 | 3106 | 2090 | 778 | 569 | 177 | 112 | 97 | 122 | 668 | 1573 | 1151.67 |
| 1982 | 3679 | 3108 | 3547 | 2710 | 867 | 490 | 283 | 200 | 236 | 539 | 1060 | 2062 | 1565.08 |
| 1983 | 2932 | 2074 | 2927 | 1643 | 779 | 435 | 154 | 93 | 82 | 82 | 403 | 1090 | 1057.83 |
| 1984 | 2839 | 4455 | 3286 | 2900 | 1098 | 340 | 188 | 123 | 125 | 254 | 1625 | 2782 | 1667.92 |
| 1985 | 3083 | 1908 | 3653 | 3932 | 1850 | 633 | 170 | 128 | 131 | 402 | 1651 | 1921 | 1621.83 |
| 1986 | 2889 | 3968 | 3509 | 2886 | 1381 | 494 | 172 | 126 | 157 | 334 | 678 | 2160 | 1562.83 |
| 1987 | 2977 | 1940 | 1433 | 1567 | 978 | 259 | 151 | 109 | 97 | 149 | 882 | 2315 | 1071.42 |
| 1988 | 2106 | 3517 | 1601 | 1871 | 796 | 378 | 164 | 104 | 96 | 133 | 330 | 1661 | 1063.08 |
| 1989 | 2682 | 4184 | 3218 | 2686 | 1022 | 366 | 208 | 125 | 97 | 181 | 633 | 468 | 1322.5 |
| 1990 | 2657 | 3679 | 3903 | 1963 | 748 | 363 | 121 | 77 | 76 | 329 | 1750 | 2804 | 1539.17 |
| 1991 | 3677 | 3679 | 2880 | 2182 | 1073 | 408 | 167 | 136 | 113 | 119 | 444 | 1364 | 1353.5 |
| 1992 | 2016 | 2076 | 2048 | 2154 | 818 | 469 | 211 | 131 | 244 | 455 | 894 | 1670 | 1098.83 |
| 1993 | 3281 | 2914 | 3696 | 3404 | 1747 | 550 | 279 | 205 | 169 | 290 | 1691 | 2202 | 1702.33 |
| 1994 | 3016 | 3348 | 1814 | 3256 | 1041 | 255 | -9999 | -9999 | -9999 | -9999 | -9999 | -9999 | -9999 |
| 1995 | -9999 | -9999 | -9999 | -9999 | -9999 | -9999 | 239 | 185 | 146 | 144 | 452 | 2524 | -9999 |
| 1996 | 2727 | 3991 | 3972 | 2509 | 920 | 322 | 172 | 131 | 140 | 273 | 760 | 1624 | 1461.75 |
| |
|
|
|
|
|
|
|
|
|
|
|
|
|
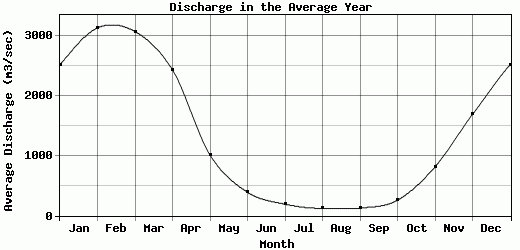
| Avg | 2520 | 3135.55 | 3073.41 | 2433.03 | 1012.48 | 390.83 | 192.86 | 122.76 | 127.28 | 257.52 | 815.41 | 1689.93 | 1312.32 |
| |
|
|
|
|
|
|
|
|
|
|
|
|
|
| Std Dev | 654.94 |
1012.83 |
948.85 |
734.83 |
381.14 |
118.01 |
82.15 |
39.61 |
51.82 |
120.07 |
493.57 |
675.82 |
255.09 |
| |
|
|
|
|
|
|
|
|
|
|
|
|
|
| | Jan | Feb | Mar | Apr | May | Jun | Jul | Aug | Sep | Oct | Nov | Dec | Avg Annual |
Click here for this table in tab-delimited format.
Tab-delimited format will open in most table browsing software, i.e. Excel, etc.
View this station on the map.
Return to start.