Results
| Country: | India
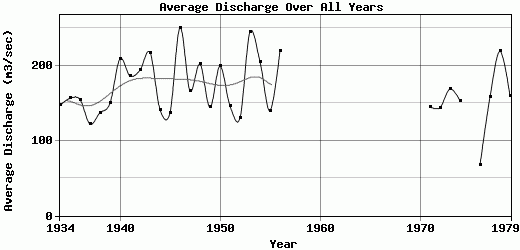
| | Station: | Krisnarajasagar | | River: | Cauvery | | Area: | 10600 km2 | | Lat: | 12.42 | | Lon: | 76.58 | | Source: | RivDIS | | PointID: | 837 | | Area Units: | km2 | | Discharge Units: | m3/sec | | Starting Year: | 1934 | | Ending Year: | 1979 | | Total Years: | 46 | | Total Usable Years: | 32 | |
| |
| Year | Jan | Feb | Mar | Apr | May | Jun | Jul | Aug | Sep | Oct | Nov | Dec | Avg Annual |
|---|
| 1934 | 29 | 20 | 13 | 9 | 9 | 141 | 510 | 691 | 96 | 177 | 56 | 15 | 147.17 |
| 1935 | 8 | 9 | 2 | 6 | 7 | 46 | 640 | 457 | 417 | 220 | 44 | 21 | 156.42 |
| 1936 | 10 | 6 | 5 | 8 | 8 | 272 | 671 | 485 | 179 | 147 | 51 | 16 | 154.83 |
| 1937 | 7 | 7 | 4 | 6 | 16 | 70 | 576 | 430 | 96 | 198 | 40 | 15 | 122.08 |
| 1938 | 4 | 9 | 3 | 3 | 4 | 247 | 634 | 325 | 182 | 200 | 28 | 7 | 137.17 |
| 1939 | 6 | 6 | 2 | 2 | 4 | 37 | 662 | 511 | 193 | 266 | 85 | 23 | 149.75 |
| 1940 | 11 | 13 | 6 | 8 | 45 | 319 | 917 | 815 | 156 | 131 | 26 | 62 | 209.08 |
| 1941 | 6 | 28 | 13 | 15 | 32 | 317 | 810 | 602 | 197 | 147 | 29 | 38 | 186.17 |
| 1942 | 6 | 8 | 3 | 9 | 17 | 163 | 1033 | 595 | 270 | 140 | 41 | 42 | 193.92 |
| 1943 | 24 | 10 | 6 | 9 | 71 | 194 | 1133 | 257 | 318 | 408 | 141 | 39 | 217.5 |
| 1944 | 19 | 14 | 12 | 7 | 20 | 51 | 833 | 364 | 103 | 133 | 98 | 43 | 141.42 |
| 1945 | 19 | 11 | 6 | 10 | 10 | 64 | 770 | 331 | 191 | 158 | 49 | 23 | 136.83 |
| 1946 | 15 | 13 | 10 | 12 | 10 | 226 | 815 | 1196 | 304 | 155 | 175 | 73 | 250.33 |
| 1947 | 13 | 12 | 8 | 15 | 12 | 19 | 591 | 615 | 429 | 228 | 24 | 32 | 166.5 |
| 1948 | 16 | 11 | 3 | 20 | 39 | 179 | 591 | 1021 | 259 | 162 | 78 | 43 | 201.83 |
| 1949 | 17 | 10 | 8 | 9 | 20 | 152 | 475 | 539 | 264 | 158 | 52 | 28 | 144.33 |
| 1950 | 18 | 16 | 5 | 1 | 8 | 86 | 966 | 501 | 534 | 164 | 70 | 23 | 199.33 |
| 1951 | 17 | 11 | 4 | 12 | 22 | 162 | 573 | 477 | 164 | 229 | 59 | 25 | 146.25 |
| 1952 | 7 | 11 | 7 | 8 | 11 | 93 | 367 | 606 | 117 | 259 | 33 | 43 | 130.17 |
| 1953 | 18 | 10 | 8 | 8 | 23 | 104 | 1049 | 1110 | 172 | 368 | 49 | 16 | 244.58 |
| 1954 | 7 | 2 | 1 | 6 | 45 | 216 | 842 | 796 | 241 | 244 | 26 | 37 | 205.25 |
| 1955 | 19 | 8 | 2 | 9 | 93 | 202 | 322 | 258 | 305 | 311 | 101 | 45 | 139.58 |
| 1956 | 22 | 14 | 6 | 8 | 27 | 229 | 986 | 615 | 163 | 291 | 255 | 27 | 220.25 |
| 1957 | -9999 | -9999 | -9999 | -9999 | -9999 | -9999 | -9999 | -9999 | -9999 | -9999 | -9999 | -9999 | -9999 |
| 1958 | -9999 | -9999 | -9999 | -9999 | -9999 | -9999 | -9999 | -9999 | -9999 | -9999 | -9999 | -9999 | -9999 |
| 1959 | -9999 | -9999 | -9999 | -9999 | -9999 | -9999 | -9999 | -9999 | -9999 | -9999 | -9999 | -9999 | -9999 |
| 1960 | -9999 | -9999 | -9999 | -9999 | -9999 | -9999 | -9999 | -9999 | -9999 | -9999 | -9999 | -9999 | -9999 |
| 1961 | -9999 | -9999 | -9999 | -9999 | -9999 | -9999 | -9999 | -9999 | -9999 | -9999 | -9999 | -9999 | -9999 |
| 1962 | -9999 | -9999 | -9999 | -9999 | -9999 | -9999 | -9999 | -9999 | -9999 | -9999 | -9999 | -9999 | -9999 |
| 1963 | -9999 | -9999 | -9999 | -9999 | -9999 | -9999 | -9999 | -9999 | -9999 | -9999 | -9999 | -9999 | -9999 |
| 1964 | -9999 | -9999 | -9999 | -9999 | -9999 | -9999 | -9999 | -9999 | -9999 | -9999 | -9999 | -9999 | -9999 |
| 1965 | -9999 | -9999 | -9999 | -9999 | -9999 | -9999 | -9999 | -9999 | -9999 | -9999 | -9999 | -9999 | -9999 |
| 1966 | -9999 | -9999 | -9999 | -9999 | -9999 | -9999 | -9999 | -9999 | -9999 | -9999 | -9999 | -9999 | -9999 |
| 1967 | -9999 | -9999 | -9999 | -9999 | -9999 | -9999 | -9999 | -9999 | -9999 | -9999 | -9999 | -9999 | -9999 |
| 1968 | -9999 | -9999 | -9999 | -9999 | -9999 | -9999 | -9999 | -9999 | -9999 | -9999 | -9999 | -9999 | -9999 |
| 1969 | -9999 | -9999 | -9999 | -9999 | -9999 | -9999 | -9999 | -9999 | -9999 | -9999 | -9999 | -9999 | -9999 |
| 1970 | -9999 | -9999 | -9999 | -9999 | -9999 | -9999 | -9999 | -9999 | -9999 | -9999 | -9999 | -9999 | -9999 |
| 1971 | 5 | 4 | 1 | 3 | 15 | 447 | 478 | 345 | 194 | 164 | 50 | 36 | 145.17 |
| 1972 | 12 | 5 | 2 | 4 | 77 | 45 | 732 | 287 | 190 | 317 | 29 | 26 | 143.83 |
| 1973 | 1 | 3 | 2 | 6 | 26 | 336 | 861 | 555 | 71 | 71 | 71 | 24 | 168.92 |
| 1974 | 9 | 9 | 2 | 2 | 13 | 9 | 647 | 789 | 211 | 123 | 13 | 13 | 153.33 |
| 1975 | -9999 | -9999 | -9999 | -9999 | -9999 | -9999 | -9999 | -9999 | -9999 | -9999 | -9999 | -9999 | -9999 |
| 1976 | 1 | 1 | 1 | 4 | 6 | 9 | 193 | 330 | 168 | 23 | 62 | 8 | 67.17 |
| 1977 | 1 | 1 | 2 | 10 | 41 | 123 | 536 | 364 | 255 | 375 | 153 | 33 | 157.83 |
| 1978 | 3 | 1 | 6 | 8 | 49 | 290 | 609 | 1090 | 370 | 135 | 41 | 27 | 219.08 |
| 1979 | 24 | 4 | 12 | 2 | 8 | 93 | 390 | 945 | 198 | 108 | 99 | 35 | 159.83 |
| |
|
|
|
|
|
|
|
|
|
|
|
|
|
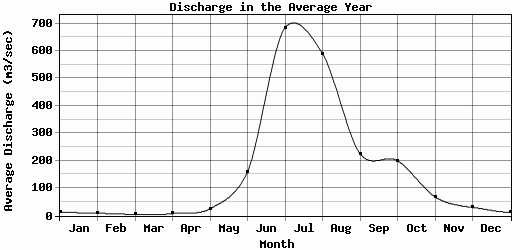
| Avg | 12.06 | 9.26 | 5.32 | 7.71 | 25.42 | 159.39 | 684.26 | 590.39 | 226.03 | 200.32 | 68.65 | 30.26 | 168.25 |
| |
|
|
|
|
|
|
|
|
|
|
|
|
|
| Std Dev | 7.5 |
5.7 |
3.63 |
4.18 |
22.2 |
109.43 |
223.87 |
260.83 |
103.81 |
88.61 |
51.22 |
14.46 |
39.09 |
| |
|
|
|
|
|
|
|
|
|
|
|
|
|
| | Jan | Feb | Mar | Apr | May | Jun | Jul | Aug | Sep | Oct | Nov | Dec | Avg Annual |
Click here for this table in tab-delimited format.
Tab-delimited format will open in most table browsing software, i.e. Excel, etc.
View this station on the map.
Return to start.