Results
| Country: | Brasil
| | Station: | Seringal Fortaleza | | River: | Purus | | Area: | 153016 km2 | | Lat: | -7.68 | | Lon: | -66.93 | | Source: | ANEEL | | PointID: | 14 | | Area Units: | km2 | | Discharge Units: | m3/sec | | Starting Year: | 1967 | | Ending Year: | 1996 | | Total Years: | 30 | | Total Usable Years: | 30 | |
| |
| Year | Jan | Feb | Mar | Apr | May | Jun | Jul | Aug | Sep | Oct | Nov | Dec | Avg Annual |
|---|
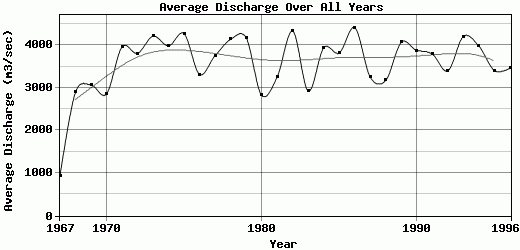
| 1967 | 1388 | 1141 | 1308 | 898 | 460 | 209 | 100 | 481 | 399 | 495 | 1367 | 2944 | 932.5 |
| 1968 | 3629 | 6113 | 5786 | 5971 | 3306 | 1024 | 640 | 537 | 711 | 820 | 1978 | 4234 | 2895.75 |
| 1969 | 6160 | 8245 | 6574 | 5658 | 2958 | 1690 | 965 | 583 | 478 | 700 | 868 | 1930 | 3067.42 |
| 1970 | 3781 | 3910 | 6219 | 6966 | 6656 | 1801 | 1013 | 635 | 530 | 603 | 675 | 1489 | 2856.5 |
| 1971 | 4082 | 7251 | 10035 | 8733 | 6197 | 2121 | 1244 | 747 | 548 | 744 | 2188 | 3678 | 3964 |
| 1972 | 5735 | 8062 | 8769 | 8583 | 5301 | 2275 | 1047 | 782 | 698 | 719 | 1158 | 2597 | 3810.5 |
| 1973 | 4581 | 6855 | 8843 | 7680 | 5663 | 2713 | 1841 | 1199 | 794 | 891 | 3628 | 5865 | 4212.75 |
| 1974 | 5807 | 9060 | 10508 | 6935 | 3995 | 1967 | 1199 | 834 | 748 | 1074 | 1568 | 4158 | 3987.75 |
| 1975 | 6922 | 8774 | 10316 | 10042 | 5616 | 2168 | 1645 | 820 | 720 | 830 | 1153 | 2247 | 4271.08 |
| 1976 | 5554 | 8116 | 8672 | 7541 | 3107 | 1408 | 712 | 482 | 411 | 461 | 911 | 2403 | 3314.83 |
| 1977 | 5901 | 5091 | 8794 | 6703 | 5066 | 1729 | 935 | 629 | 541 | 1316 | 3610 | 4790 | 3758.75 |
| 1978 | 5261 | 5934 | 7121 | 8513 | 6136 | 3056 | 1150 | 781 | 620 | 1507 | 3050 | 6564 | 4141.08 |
| 1979 | 8619 | 7487 | 8700 | 9792 | 5779 | 2703 | 904 | 677 | 642 | 689 | 1498 | 2609 | 4174.92 |
| 1980 | 4309 | 5819 | 6353 | 6045 | 3596 | 1572 | 726 | 562 | 493 | 875 | 1211 | 2316 | 2823.08 |
| 1981 | 3565 | 6531 | 8842 | 7188 | 3376 | 2228 | 942 | 562 | 507 | 557 | 1199 | 3598 | 3257.92 |
| 1982 | 7126 | 8458 | 10200 | 7766 | 4981 | 2124 | 1090 | 767 | 724 | 1315 | 2349 | 5109 | 4334.08 |
| 1983 | 6766 | 5799 | 6403 | 5730 | 3539 | 1517 | 861 | 533 | 459 | 458 | 863 | 2169 | 2924.75 |
| 1984 | 4791 | 7238 | 9416 | 8578 | 5201 | 2149 | 1003 | 661 | 600 | 722 | 2388 | 4571 | 3943.17 |
| 1985 | 5635 | 5681 | 7313 | 7632 | 6053 | 2180 | 1074 | 646 | 660 | 1071 | 3038 | 4846 | 3819.08 |
| 1986 | 6906 | 8811 | 9360 | 10054 | 6232 | 2422 | 1166 | 896 | 867 | 993 | 1053 | 4164 | 4410.33 |
| 1987 | 6285 | 7222 | 6218 | 4864 | 3843 | 1361 | 937 | 610 | 457 | 766 | 2108 | 4314 | 3248.75 |
| 1988 | 4733 | 8385 | 7073 | 5152 | 3305 | 2739 | 957 | 625 | 484 | 555 | 847 | 3283 | 3178.17 |
| 1989 | 5977 | 9019 | 9596 | 8958 | 6376 | 2517 | 1460 | 787 | 574 | 660 | 1480 | 1444 | 4070.67 |
| 1990 | 5542 | 8102 | 8385 | 6949 | 3501 | 1558 | 978 | 611 | 528 | 1115 | 3670 | 5620 | 3879.92 |
| 1991 | 7687 | 7677 | 8306 | 6961 | 4662 | 1942 | 1095 | 721 | 613 | 570 | 1576 | 3697 | 3792.25 |
| 1992 | 5147 | 5588 | 8156 | 8229 | 3960 | 1778 | 1009 | 686 | 771 | 968 | 1383 | 3110 | 3398.75 |
| 1993 | 5607 | 7225 | 7901 | 9211 | 6665 | 2344 | 1184 | 759 | 638 | 791 | 3137 | 5055 | 4209.75 |
| 1994 | 6600 | 8502 | 8234 | 8429 | 5913 | 2621 | 1210 | 829 | 682 | 657 | 1096 | 2993 | 3980.5 |
| 1995 | 4124 | 4669 | 8139 | 8322 | 4339 | 2206 | 1716 | 1263 | 1046 | 758 | 1108 | 3187 | 3406.42 |
| 1996 | 3740 | 6974 | 8424 | 8714 | 4140 | 1780 | 946 | 619 | 513 | 721 | 1669 | 3321 | 3463.42 |
| |
|
|
|
|
|
|
|
|
|
|
|
|
|
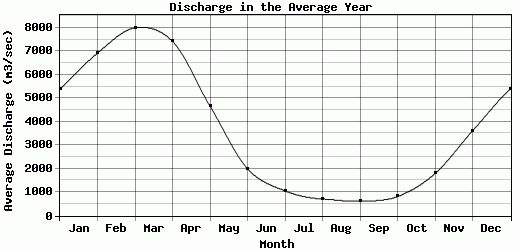
| Avg | 5398.67 | 6924.63 | 7998.8 | 7426.57 | 4664.07 | 1996.73 | 1058.3 | 710.8 | 615.2 | 813.37 | 1794.23 | 3610.17 | 3584.29 |
| |
|
|
|
|
|
|
|
|
|
|
|
|
|
| Std Dev | 1448.31 |
1718.7 |
1794.27 |
1831.55 |
1409.33 |
569.73 |
323.63 |
175.66 |
142.27 |
256.74 |
901.46 |
1292.08 |
685.87 |
| |
|
|
|
|
|
|
|
|
|
|
|
|
|
| | Jan | Feb | Mar | Apr | May | Jun | Jul | Aug | Sep | Oct | Nov | Dec | Avg Annual |
Click here for this table in tab-delimited format.
Tab-delimited format will open in most table browsing software, i.e. Excel, etc.
View this station on the map.
Return to start.