Results
| Country: | Brasil
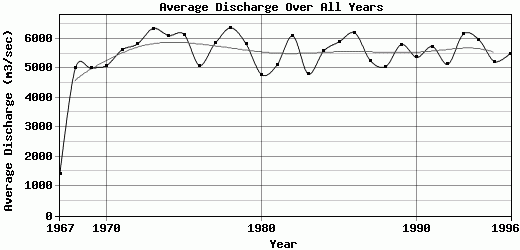
| | Station: | Labrea | | River: | Purus | | Area: | 220351 km2 | | Lat: | -7.25 | | Lon: | -64.8 | | Source: | ANEEL | | PointID: | 16 | | Area Units: | km2 | | Discharge Units: | m3/sec | | Starting Year: | 1967 | | Ending Year: | 1996 | | Total Years: | 30 | | Total Usable Years: | 30 | |
| |
| Year | Jan | Feb | Mar | Apr | May | Jun | Jul | Aug | Sep | Oct | Nov | Dec | Avg Annual |
|---|
| 1967 | 992 | 1204 | 1531 | 1227 | 1062 | 723 | 1703 | 1089 | 779 | 890 | 1876 | 4014 | 1424.17 |
| 1968 | 6326 | 7968 | 9790 | 10115 | 9266 | 3700 | 1638 | 1140 | 1177 | 1370 | 2407 | 5214 | 5009.25 |
| 1969 | 7873 | 9695 | 10393 | 10216 | 8428 | 3846 | 1965 | 1152 | 866 | 1280 | 1508 | 2854 | 5006.33 |
| 1970 | 5976 | 7457 | 9787 | 10337 | 10365 | 7057 | 2716 | 1559 | 1069 | 1161 | 1412 | 2147 | 5086.92 |
| 1971 | 5506 | 8416 | 10615 | 10905 | 10227 | 6827 | 2451 | 1686 | 1217 | 1342 | 3185 | 5053 | 5619.17 |
| 1972 | 6981 | 9947 | 10492 | 10633 | 10373 | 7349 | 3035 | 1795 | 1490 | 1404 | 2250 | 4108 | 5821.42 |
| 1973 | 6486 | 8441 | 10444 | 10777 | 10410 | 7114 | 4064 | 2485 | 1714 | 1688 | 4372 | 8136 | 6344.25 |
| 1974 | 9011 | 10304 | 11467 | 10839 | 9764 | 5336 | 2540 | 1647 | 1434 | 1820 | 2867 | 6270 | 6108.25 |
| 1975 | 9738 | 10635 | 11226 | 11739 | 10462 | 6709 | 3190 | 1913 | 1404 | 1503 | 1996 | 3190 | 6142.08 |
| 1976 | 7261 | 10115 | 10664 | 10670 | 8919 | 4080 | 1822 | 1122 | 895 | 913 | 1464 | 3169 | 5091.17 |
| 1977 | 7473 | 9027 | 10361 | 10810 | 9422 | 5212 | 2360 | 1473 | 1148 | 1849 | 4092 | 6852 | 5839.92 |
| 1978 | 8989 | 9386 | 10151 | 10687 | 10673 | 7779 | 2698 | 1659 | 1214 | 2091 | 4051 | 7015 | 6366.08 |
| 1979 | 10450 | 10688 | 10798 | 11158 | 10070 | 5659 | 1925 | 1311 | 1193 | 1172 | 1790 | 3588 | 5816.83 |
| 1980 | 6252 | 8047 | 9543 | 10408 | 7901 | 3546 | 1644 | 1116 | 976 | 1485 | 2261 | 4142 | 4776.75 |
| 1981 | 5611 | 8695 | 10568 | 10784 | 9169 | 4653 | 1956 | 1182 | 949 | 984 | 1628 | 5149 | 5110.67 |
| 1982 | 8458 | 10370 | 10901 | 10981 | 10389 | 6196 | 2370 | 1525 | 1241 | 1872 | 2754 | 5986 | 6086.92 |
| 1983 | 8660 | 9411 | 8988 | 10509 | 8128 | 3674 | 1688 | 1101 | 820 | 734 | 1145 | 2790 | 4804 |
| 1984 | 5631 | 9093 | 10742 | 10958 | 10473 | 5749 | 2229 | 1357 | 1161 | 1178 | 2604 | 5789 | 5580.33 |
| 1985 | 7894 | 9650 | 10180 | 10728 | 10460 | 5648 | 2121 | 1436 | 1249 | 1428 | 3481 | 6449 | 5893.67 |
| 1986 | 9772 | 10847 | 11064 | 11184 | 10787 | 6657 | 2458 | 1575 | 1413 | 1581 | 1790 | 5181 | 6192.42 |
| 1987 | 8415 | 10684 | 10880 | 9932 | 8474 | 3592 | 1947 | 1168 | 822 | 836 | 1687 | 4641 | 5256.5 |
| 1988 | 6778 | 10148 | 11028 | 9923 | 8568 | 4181 | 1816 | 1065 | 781 | 785 | 1083 | 4490 | 5053.83 |
| 1989 | 6921 | 10444 | 11346 | 11141 | 10851 | 7058 | 3211 | 1730 | 1152 | 1196 | 2198 | 2361 | 5800.75 |
| 1990 | 6486 | 9784 | 10931 | 10930 | 8501 | 3365 | 1897 | 1098 | 850 | 1142 | 2795 | 6633 | 5367.67 |
| 1991 | 8881 | 10622 | 11057 | 11006 | 9809 | 5684 | 2458 | 1371 | 1024 | 949 | 1589 | 4365 | 5734.58 |
| 1992 | 6651 | 8472 | 10395 | 11132 | 9673 | 4110 | 1915 | 1196 | 1074 | 1405 | 1679 | 3882 | 5132 |
| 1993 | 6663 | 9919 | 10989 | 11204 | 11050 | 6862 | 2436 | 1507 | 1221 | 1347 | 3957 | 6722 | 6156.42 |
| 1994 | 9674 | 11060 | 11278 | 11216 | 10840 | 6189 | 2720 | 1305 | 843 | 821 | 1393 | 4220 | 5963.25 |
| 1995 | 7162 | 8014 | 10261 | 11188 | 9806 | 5279 | 2036 | 1234 | 944 | 897 | 1550 | 4349 | 5226.67 |
| 1996 | 5996 | 8696 | 10857 | 11177 | 10608 | 5537 | 2029 | 1325 | 1035 | 1121 | 2617 | 4928 | 5493.83 |
| |
|
|
|
|
|
|
|
|
|
|
|
|
|
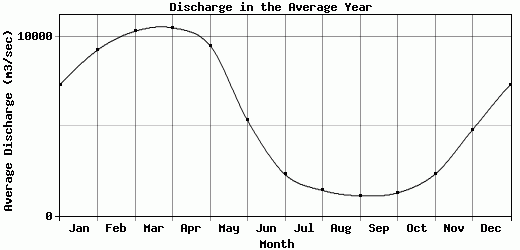
| Avg | 7298.9 | 9241.3 | 10290.9 | 10483.8 | 9497.6 | 5312.37 | 2301.27 | 1410.73 | 1105.17 | 1274.8 | 2316.03 | 4789.57 | 5443.54 |
| |
|
|
|
|
|
|
|
|
|
|
|
|
|
| Std Dev | 1806.25 |
1788.22 |
1716.7 |
1766.68 |
1803.36 |
1562.52 |
547.36 |
309.5 |
230.72 |
351.67 |
918.4 |
1481.42 |
882.02 |
| |
|
|
|
|
|
|
|
|
|
|
|
|
|
| | Jan | Feb | Mar | Apr | May | Jun | Jul | Aug | Sep | Oct | Nov | Dec | Avg Annual |
Click here for this table in tab-delimited format.
Tab-delimited format will open in most table browsing software, i.e. Excel, etc.
View this station on the map.
Return to start.