Results
| Country: | Brasil
| | Station: | Caracarai | | River: | Branco | | Area: | 124980 km2 | | Lat: | 1.8 | | Lon: | -61.13 | | Source: | ANEEL | | PointID: | 22 | | Area Units: | km2 | | Discharge Units: | m3/sec | | Starting Year: | 1967 | | Ending Year: | 1996 | | Total Years: | 30 | | Total Usable Years: | 28 | |
| |
| Year | Jan | Feb | Mar | Apr | May | Jun | Jul | Aug | Sep | Oct | Nov | Dec | Avg Annual |
|---|
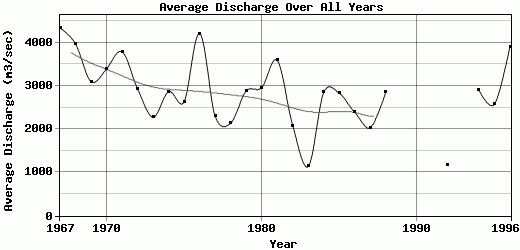
| 1967 | 1786 | 1341 | 1279 | 1853 | 7076 | 11178 | 10540 | 7913 | 3969 | 2095 | 1632 | 1483 | 4345.42 |
| 1968 | 1391 | 1688 | 1261 | 3358 | 5666 | 8820 | 10461 | 5064 | 3746 | 2202 | 1953 | 2132 | 3978.5 |
| 1969 | 1806 | 1652 | 1046 | 3225 | 4824 | 6374 | 5438 | 6015 | 3130 | 1797 | 1118 | 797 | 3101.83 |
| 1970 | 1023 | 1073 | 1028 | 2410 | 4282 | 5044 | 7484 | 8093 | 4599 | 1862 | 2513 | 1326 | 3394.75 |
| 1971 | 1519 | 1712 | 1535 | 2119 | 4146 | 7454 | 10498 | 5479 | 4696 | 2409 | 2283 | 1668 | 3793.17 |
| 1972 | 1547 | 1566 | 2046 | 2548 | 6747 | 5826 | 5458 | 3080 | 2433 | 1218 | 1806 | 897 | 2931 |
| 1973 | 613 | 508 | 345 | 397 | 965 | 3134 | 3611 | 4199 | 5869 | 3434 | 2067 | 2190 | 2277.67 |
| 1974 | 2072 | 2089 | 1414 | 3473 | 1060 | 1803 | 5666 | 6303 | 4895 | 2425 | 2031 | 1237 | 2872.33 |
| 1975 | 1438 | 902 | 811 | 572 | 1120 | 3731 | 5095 | 8373 | 5194 | 1701 | 1114 | 1575 | 2635.5 |
| 1976 | 1749 | 1602 | 2182 | 4874 | 8800 | 8499 | 10806 | 5421 | 2485 | 1838 | 1104 | 1212 | 4214.33 |
| 1977 | 805 | 493 | 598 | 701 | 1794 | 5216 | 7161 | 4843 | 2172 | 2047 | 1049 | 694 | 2297.75 |
| 1978 | 521 | 480 | 416 | 494 | 1982 | 4918 | 4962 | 5150 | 3582 | 1344 | 976 | 829 | 2137.83 |
| 1979 | 712 | 447 | 609 | 1213 | 2960 | 8401 | 7881 | 4686 | 2745 | 1958 | 1607 | 1389 | 2884 |
| 1980 | 818 | 507 | 321 | 686 | 5544 | 7456 | 8461 | 4218 | 3127 | 1616 | 1498 | 1281 | 2961.08 |
| 1981 | 1082 | 751 | 1020 | 1448 | 4988 | 6852 | 10353 | 6403 | 5158 | 2799 | 1372 | 914 | 3595 |
| 1982 | 992 | 1034 | 1178 | 1840 | 4792 | 5969 | 3457 | 2340 | 1216 | 1034 | 558 | 592 | 2083.5 |
| 1983 | 710 | 299 | 379 | 1395 | 2835 | 1959 | 1578 | 1805 | 1149 | 444 | 422 | 694 | 1139.08 |
| 1984 | 766 | 1183 | 684 | 735 | 2347 | 5622 | 6492 | 5244 | 4778 | 2233 | 2737 | 1402 | 2851.92 |
| 1985 | 1654 | 591 | 518 | 480 | 2104 | 5507 | 5889 | 6960 | 4793 | 1895 | 1817 | 1803 | 2834.25 |
| 1986 | 729 | 781 | 1230 | 568 | 935 | 7110 | 7587 | 3308 | 1595 | 1707 | 1561 | 1571 | 2390.17 |
| 1987 | 771 | 638 | 496 | 636 | 3652 | 3920 | 5165 | 3110 | 2794 | 1635 | 1043 | 588 | 2037.33 |
| 1988 | 620 | 726 | 333 | 244 | 380 | 3081 | 7693 | 8337 | 5661 | 2816 | 1714 | 2671 | 2856.33 |
| 1989 | 1919 | 1587 | 1558 | 2059 | 3546 | 7656 | 6901 | -9999 | -9999 | -9999 | -9999 | -9999 | -9999 |
| 1990 | -9999 | -9999 | -9999 | -9999 | -9999 | -9999 | -9999 | -9999 | -9999 | -9999 | -9999 | -9999 | -9999 |
| 1991 | -9999 | -9999 | -9999 | -9999 | -9999 | 8407 | 9087 | 7595 | 3937 | 1690 | 953 | 800 | -9999 |
| 1992 | 644 | 378 | 586 | 514 | 1192 | 1870 | 2298 | 3584 | 1188 | 631 | 588 | 538 | 1167.58 |
| 1993 | 646 | 487 | 1351 | 1129 | 3934 | 4633 | 5368 | 3609 | 1824 | -9999 | -9999 | -9999 | -9999 |
| 1994 | 968 | 1085 | 706 | 690 | 3626 | 6240 | 6802 | 5022 | 3517 | 3295 | 1466 | 1431 | 2904 |
| 1995 | 685 | 390 | 558 | 432 | 1131 | 6539 | 7609 | 6379 | 2388 | 1472 | 1721 | 1614 | 2576.5 |
| 1996 | 1163 | 1766 | 1551 | 1116 | 4490 | 8774 | 10667 | 8133 | 4520 | 2138 | 1486 | 1123 | 3910.58 |
| |
|
|
|
|
|
|
|
|
|
|
|
|
|
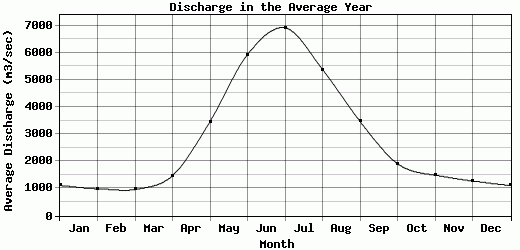
| Avg | 1112.46 | 991.29 | 965.68 | 1471.75 | 3461.36 | 5930.79 | 6912.69 | 5380.93 | 3470 | 1916.11 | 1488.48 | 1275.96 | 2852.75 |
| |
|
|
|
|
|
|
|
|
|
|
|
|
|
| Std Dev | 468.19 |
524.12 |
511.97 |
1148.03 |
2092.9 |
2287.46 |
2504.61 |
1858.44 |
1392.89 |
680.99 |
565.44 |
525.54 |
803.89 |
| |
|
|
|
|
|
|
|
|
|
|
|
|
|
| | Jan | Feb | Mar | Apr | May | Jun | Jul | Aug | Sep | Oct | Nov | Dec | Avg Annual |
Click here for this table in tab-delimited format.
Tab-delimited format will open in most table browsing software, i.e. Excel, etc.
View this station on the map.
Return to start.