Results
| Country: | U.S.A.
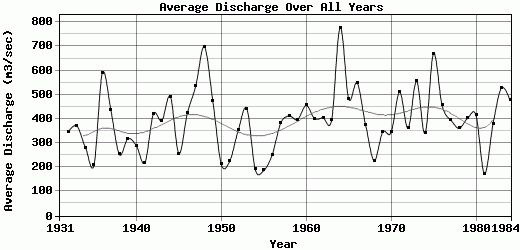
| | Station: | Doctortown,Georgia | | River: | Altamaha | | Area: | 35224 km2 | | Lat: | 31.65 | | Lon: | -81.82 | | Source: | | | PointID: | 403 | | Area Units: | km2 | | Discharge Units: | m3/sec | | Starting Year: | 1931 | | Ending Year: | 1984 | | Total Years: | 54 | | Total Usable Years: | 53 | |
| |
| Year | Jan | Feb | Mar | Apr | May | Jun | Jul | Aug | Sep | Oct | Nov | Dec | Avg Annual |
|---|
| 1931 | -9999 | -9999 | -9999 | -9999 | -9999 | -9999 | -9999 | -9999 | -9999 | 60 | 62 | 173 | -9999 |
| 1932 | 470 | 419 | 552 | 300 | 170 | 223 | 233 | 438 | 193 | 317 | 376 | 481 | 347.67 |
| 1933 | 758 | 1050 | 778 | 413 | 267 | 152 | 181 | 137 | 382 | 113 | 101 | 121 | 371.08 |
| 1934 | 158 | 234 | 724 | 336 | 351 | 631 | 185 | 160 | 124 | 210 | 115 | 143 | 280.92 |
| 1935 | 224 | 200 | 363 | 346 | 208 | 117 | 176 | 173 | 350 | 97 | 115 | 124 | 207.75 |
| 1936 | 885 | 1591 | 593 | 2292 | 294 | 172 | 129 | 258 | 153 | 264 | 151 | 306 | 590.67 |
| 1937 | 660 | 966 | 756 | 736 | 695 | 227 | 206 | 224 | 215 | 154 | 202 | 179 | 435 |
| 1938 | 217 | 164 | 192 | 825 | 243 | 273 | 310 | 434 | 94 | 78 | 90 | 118 | 253.17 |
| 1939 | 182 | 456 | 1456 | 488 | 218 | 222 | 135 | 177 | 182 | 111 | 87 | 105 | 318.25 |
| 1940 | 302 | 533 | 582 | 389 | 190 | 141 | 285 | 443 | 174 | 93 | 129 | 207 | 289 |
| 1941 | 339 | 245 | 354 | 378 | 139 | 89 | 429 | 204 | 89 | 90 | 80 | 184 | 218.33 |
| 1942 | 913 | 523 | 1125 | 1011 | 264 | 258 | 191 | 175 | 134 | 117 | 123 | 202 | 419.67 |
| 1943 | 577 | 993 | 709 | 812 | 449 | 302 | 273 | 171 | 108 | 87 | 102 | 120 | 391.92 |
| 1944 | 392 | 469 | 1110 | 1836 | 908 | 224 | 161 | 154 | 173 | 170 | 130 | 183 | 492.5 |
| 1945 | 233 | 344 | 560 | 267 | 473 | 133 | 169 | 229 | 178 | 111 | 122 | 260 | 256.58 |
| 1946 | 1250 | 632 | 576 | 662 | 463 | 362 | 213 | 178 | 173 | 225 | 185 | 151 | 422.5 |
| 1947 | 364 | 572 | 987 | 953 | 439 | 252 | 262 | 222 | 167 | 229 | 788 | 1212 | 537.25 |
| 1948 | 841 | 1311 | 1465 | 1549 | 338 | 261 | 266 | 249 | 133 | 190 | 196 | 1573 | 697.67 |
| 1949 | 877 | 957 | 722 | 525 | 537 | 336 | 311 | 326 | 527 | 190 | 177 | 193 | 473.17 |
| 1950 | 193 | 200 | 437 | 321 | 167 | 174 | 161 | 130 | 208 | 181 | 166 | 213 | 212.58 |
| 1951 | 348 | 293 | 321 | 530 | 221 | 118 | 132 | 163 | 87 | 94 | 142 | 258 | 225.58 |
| 1952 | 417 | 480 | 1267 | 884 | 281 | 233 | 113 | 115 | 122 | 106 | 91 | 127 | 353 |
| 1953 | 335 | 607 | 994 | 630 | 805 | 179 | 220 | 174 | 167 | 506 | 141 | 551 | 442.42 |
| 1954 | 720 | 348 | 311 | 279 | 150 | 102 | 76 | 67 | 60 | 49 | 50 | 76 | 190.67 |
| 1955 | 166 | 312 | 199 | 363 | 182 | 127 | 116 | 155 | 256 | 145 | 100 | 119 | 186.67 |
| 1956 | 114 | 480 | 518 | 605 | 305 | 123 | 167 | 109 | 98 | 243 | 126 | 136 | 252 |
| 1957 | 321 | 304 | 353 | 703 | 534 | 415 | 237 | 208 | 130 | 329 | 240 | 820 | 382.83 |
| 1958 | 483 | 744 | 1122 | 1040 | 514 | 219 | 295 | 163 | 97 | 88 | 76 | 103 | 412 |
| 1959 | 138 | 764 | 1049 | 696 | 239 | 513 | 179 | 121 | 170 | 210 | 377 | 312 | 397.33 |
| 1960 | 442 | 1342 | 1070 | 1347 | 343 | 178 | 167 | 143 | 102 | 129 | 95 | 111 | 455.75 |
| 1961 | 138 | 206 | 1138 | 1163 | 684 | 262 | 256 | 192 | 323 | 93 | 92 | 256 | 400.25 |
| 1962 | 611 | 547 | 1195 | 1157 | 339 | 189 | 141 | 113 | 101 | 145 | 129 | 180 | 403.92 |
| 1963 | 329 | 985 | 727 | 370 | 375 | 394 | 722 | 213 | 108 | 153 | 103 | 268 | 395.58 |
| 1964 | 946 | 1324 | 1558 | 1390 | 1128 | 213 | 460 | 653 | 299 | 559 | 254 | 533 | 776.42 |
| 1965 | 864 | 1029 | 1138 | 984 | 280 | 296 | 268 | 205 | 138 | 242 | 143 | 197 | 482 |
| 1966 | 499 | 903 | 2036 | 440 | 496 | 755 | 314 | 315 | 139 | 185 | 282 | 218 | 548.5 |
| 1967 | 997 | 724 | 559 | 225 | 238 | 301 | 343 | 266 | 256 | 115 | 163 | 305 | 374.33 |
| 1968 | 583 | 323 | 335 | 289 | 200 | 206 | 185 | 123 | 72.4 | 82 | 133 | 195 | 227.2 |
| 1969 | 281 | 427 | 526 | 491 | 620 | 304 | 139 | 419 | 368 | 179 | 153 | 229 | 344.67 |
| 1970 | 325 | 482 | 609 | 1190 | 241 | 284 | 119 | 229 | 234 | 84.5 | 160 | 168 | 343.79 |
| 1971 | 582 | 701 | 1370 | 789 | 573 | 213 | 225 | 473 | 280 | 167 | 168 | 578 | 509.92 |
| 1972 | 948 | 1120 | 558 | 399 | 222 | 195 | 210 | 138 | 98 | 75 | 98 | 274 | 361.25 |
| 1973 | 802 | 1350 | 788 | 1320 | 559 | 646 | 305 | 297 | 153 | 148 | 110 | 182 | 555 |
| 1974 | 423 | 923 | 598 | 653 | 221 | 199 | 140 | 277 | 247 | 100 | 106 | 203 | 340.83 |
| 1975 | 629 | 894 | 1680 | 1570 | 742 | 514 | 411 | 438 | 242 | 381 | 271 | 266 | 669.83 |
| 1976 | 523 | 620 | 595 | 524 | 495 | 570 | 299 | 152 | 152 | 328 | 262 | 951 | 455.92 |
| 1977 | 980 | 470 | 1020 | 833 | 182 | 134 | 103 | 161 | 140 | 134 | 336 | 264 | 396.42 |
| 1978 | 623 | 1340 | 656 | 347 | 546 | 185 | 114 | 171 | 90 | 65 | 65 | 131 | 361.08 |
| 1979 | 281 | 616 | 1300 | 648 | 608 | 194 | 181 | 138 | 190 | 229 | 206 | 236 | 402.25 |
| 1980 | 314 | 588 | 1306 | 1419 | 346 | 342 | 189 | 100 | 78 | 88 | 88 | 118 | 414.67 |
| 1981 | 101 | 376 | 405 | 519 | 122 | 113 | 71.5 | 90.5 | 75 | 54 | 60.5 | 88.5 | 173 |
| 1982 | 759 | 904 | 550 | 468 | 424 | 296 | 228 | 211 | 111 | 113 | 118 | 347 | 377.42 |
| 1983 | 718 | 1148 | 1298 | 1349 | 373 | 166 | 137 | 90.5 | 91 | 81 | 117 | 773 | 528.46 |
| 1984 | 758 | 859 | 1089 | 858 | 696 | 277 | 182 | 528 | 119 | 91 | 123 | 147 | 477.25 |
| |
|
|
|
|
|
|
|
|
|
|
|
|
|
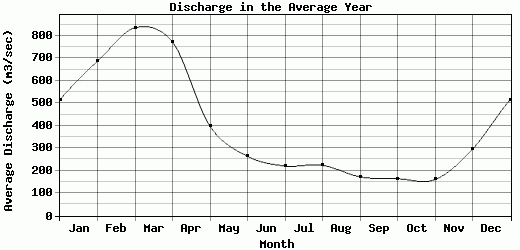
| Avg | 515.72 | 686.64 | 835.45 | 771.91 | 398.06 | 264.23 | 221.14 | 224.4 | 172.65 | 164.4 | 160.66 | 295.71 | 393.09 |
| |
|
|
|
|
|
|
|
|
|
|
|
|
|
| Std Dev | 282.19 |
361.69 |
413.54 |
450.89 |
214.51 |
145.06 |
110.03 |
123.8 |
92.42 |
104.87 |
114 |
283.95 |
129.67 |
| |
|
|
|
|
|
|
|
|
|
|
|
|
|
| | Jan | Feb | Mar | Apr | May | Jun | Jul | Aug | Sep | Oct | Nov | Dec | Avg Annual |
Click here for this table in tab-delimited format.
Tab-delimited format will open in most table browsing software, i.e. Excel, etc.
View this station on the map.
Return to start.