Results
| Country: | Brasil
| | Station: | Guajara-Mirim | | River: | Mamore | | Area: | 589500 km2 | | Lat: | -10.8 | | Lon: | -65.38 | | Source: | ANEEL | | PointID: | 24 | | Area Units: | km2 | | Discharge Units: | m3/sec | | Starting Year: | 1970 | | Ending Year: | 1996 | | Total Years: | 27 | | Total Usable Years: | 27 | |
| |
| Year | Jan | Feb | Mar | Apr | May | Jun | Jul | Aug | Sep | Oct | Nov | Dec | Avg Annual |
|---|
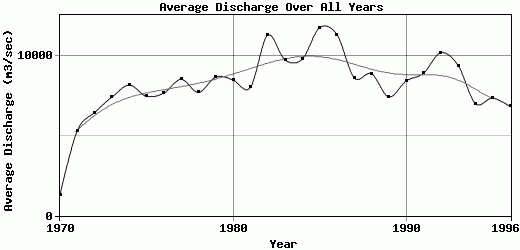
| 1970 | 1043 | 1420 | 1547 | 1780 | 1676 | 1244 | 685 | 297 | 1068 | 1119 | 1393 | 2344 | 1301.33 |
| 1971 | 5944 | 9340 | 11229 | 11516 | 7867 | 3762 | 2866 | 1397 | 1202 | 1445 | 2527 | 4560 | 5304.58 |
| 1972 | 5965 | 9657 | 11304 | 11995 | 10266 | 6708 | 3849 | 1818 | 3619 | 2753 | 3124 | 6312 | 6447.5 |
| 1973 | 8816 | 10327 | 12145 | 12986 | 12358 | 9334 | 5498 | 2779 | 1944 | 2065 | 3600 | 7085 | 7411.42 |
| 1974 | 9869 | 12217 | 14235 | 16063 | 16218 | 11190 | 5270 | 2572 | 1411 | 1143 | 3320 | 4469 | 8164.75 |
| 1975 | 8247 | 10559 | 12611 | 13666 | 12747 | 8963 | 5595 | 3184 | 1722 | 2533 | 2757 | 6835 | 7451.58 |
| 1976 | 9999 | 12679 | 14200 | 15715 | 14887 | 9405 | 4190 | 1919 | 1379 | 1283 | 2446 | 3833 | 7661.25 |
| 1977 | 9693 | 12067 | 13817 | 14388 | 14760 | 12190 | 5965 | 2781 | 1851 | 2862 | 4468 | 7407 | 8520.75 |
| 1978 | 10224 | 12517 | 14082 | 14737 | 12728 | 8311 | 5528 | 1997 | 1287 | 1462 | 2561 | 6989 | 7701.92 |
| 1979 | 11072 | 13195 | 15112 | 17755 | 17806 | 13313 | 6365 | 2343 | 1385 | 1410 | 1449 | 2659 | 8655.33 |
| 1980 | 5836 | 10004 | 13640 | 15136 | 16821 | 15298 | 8534 | 3494 | 2710 | 2346 | 3643 | 4180 | 8470.17 |
| 1981 | 6220 | 10585 | 13213 | 15150 | 15557 | 12115 | 5592 | 1999 | 1500 | 2273 | 4402 | 7577 | 8015.25 |
| 1982 | 11182 | 13143 | 15627 | 20401 | 20855 | 15656 | 9819 | 5282 | 2998 | 4410 | 6579 | 9373 | 11277.1 |
| 1983 | 11237 | 12650 | 14247 | 16243 | 15663 | 14099 | 12227 | 7288 | 2489 | 1957 | 3134 | 5600 | 9736.17 |
| 1984 | 9587 | 12651 | 15480 | 20030 | 20006 | 14410 | 6937 | 2718 | 1547 | 1223 | 4039 | 8734 | 9780.17 |
| 1985 | 13638 | 15568 | 17717 | 19345 | 20293 | 17463 | 10211 | 6084 | 4330 | 4215 | 5273 | 6730 | 11738.9 |
| 1986 | 9574 | 13911 | 16594 | 18758 | 18948 | 17183 | 11964 | 6519 | 5261 | 4275 | 4514 | 8308 | 11317.4 |
| 1987 | 11507 | 13889 | 15328 | 14795 | 11695 | 9532 | 6646 | 4752 | 2884 | 1665 | 2992 | 7708 | 8616.08 |
| 1988 | 12082 | 13822 | 15553 | 17209 | 17934 | 14022 | 6730 | 2611 | 1246 | 1212 | 1343 | 2659 | 8868.58 |
| 1989 | 8147 | 12137 | 13267 | 13168 | 11740 | 8426 | 5375 | 2366 | 2149 | 3494 | 3481 | 5320 | 7422.5 |
| 1990 | 6998 | 11075 | 12427 | 12012 | 12869 | 11514 | 8711 | 4987 | 4117 | 4061 | 5350 | 6881 | 8416.83 |
| 1991 | 10208 | 12888 | 14033 | 14804 | 14636 | 10748 | 6159 | 3419 | 2151 | 2670 | 5998 | 9055 | 8897.42 |
| 1992 | 9505 | 11061 | 14037 | 15283 | 16819 | 15665 | 9440 | 4301 | 3986 | 4667 | 6845 | 10610 | 10184.9 |
| 1993 | 12785 | 14783 | 18599 | 20541 | 16824 | 9730 | 4425 | 2256 | 1866 | 1686 | 3204 | 5981 | 9390 |
| 1994 | 9374 | 11812 | 13535 | 14173 | 11784 | 6621 | 3828 | 1904 | 1056 | 1757 | 3693 | 4509 | 7003.83 |
| 1995 | 8595 | 11839 | 13785 | 14969 | 14256 | 8917 | 3863 | 2341 | 1234 | 1154 | 1817 | 5395 | 7347.08 |
| 1996 | 7715 | 11739 | 13750 | 13401 | 9970 | 6773 | 4380 | 1586 | 827 | 1629 | 4139 | 6009 | 6826.5 |
| |
|
|
|
|
|
|
|
|
|
|
|
|
|
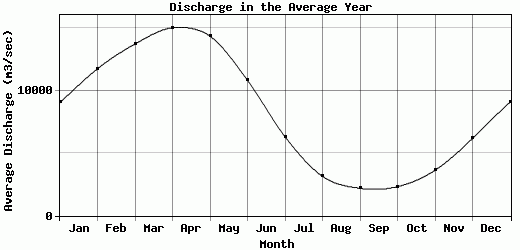
| Avg | 9076.37 | 11760.6 | 13745 | 15037.7 | 14369.7 | 10836.7 | 6320.44 | 3147.93 | 2193.3 | 2324.78 | 3633 | 6189.7 | 8219.6 |
| |
|
|
|
|
|
|
|
|
|
|
|
|
|
| Std Dev | 2571.48 |
2522.97 |
2917.81 |
3609.34 |
4088.9 |
3917.65 |
2677.58 |
1656.01 |
1151.32 |
1125.4 |
1450.66 |
2079.56 |
2008.33 |
| |
|
|
|
|
|
|
|
|
|
|
|
|
|
| | Jan | Feb | Mar | Apr | May | Jun | Jul | Aug | Sep | Oct | Nov | Dec | Avg Annual |
Click here for this table in tab-delimited format.
Tab-delimited format will open in most table browsing software, i.e. Excel, etc.
View this station on the map.
Return to start.