Results
| Country: | Brasil
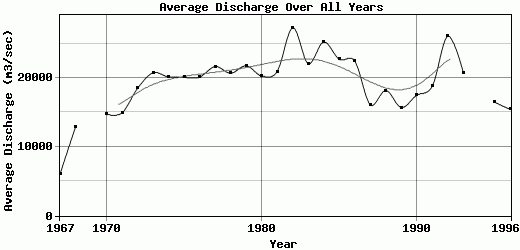
| | Station: | Porto Velho | | River: | Madeira | | Area: | 954285 km2 | | Lat: | -8.77 | | Lon: | -63.92 | | Source: | ANEEL | | PointID: | 27 | | Area Units: | km2 | | Discharge Units: | m3/sec | | Starting Year: | 1967 | | Ending Year: | 1996 | | Total Years: | 30 | | Total Usable Years: | 29 | |
| |
| Year | Jan | Feb | Mar | Apr | May | Jun | Jul | Aug | Sep | Oct | Nov | Dec | Avg Annual |
|---|
| 1967 | 760 | 1277 | 1794 | 1840 | 16966 | 11811 | 6793 | 5145 | 4010 | 4188 | 7737 | 9836 | 6013.08 |
| 1968 | 13426 | 24020 | 32944 | 25512 | 13682 | 7096 | 4777 | 3969 | 4910 | 4912 | 7318 | 11868 | 12869.5 |
| 1969 | 22449 | 25296 | 25336 | 24477 | 15464 | 11882 | 7746 | -9999 | -9999 | -9999 | 6567 | 13585 | -9999 |
| 1970 | 16765 | 22173 | 28024 | 28098 | 23495 | 17350 | 9786 | 5519 | 4837 | 4811 | 6163 | 9711 | 14727.7 |
| 1971 | 19307 | 27946 | 31044 | 25734 | 16881 | 10656 | 7813 | 4732 | 4388 | 6649 | 9130 | 14891 | 14930.9 |
| 1972 | 19873 | 27213 | 34719 | 34453 | 22846 | 16560 | 8947 | 7650 | 9813 | 10321 | 9787 | 19672 | 18487.8 |
| 1973 | 24121 | 33451 | 37748 | 36547 | 27500 | 20952 | 13018 | 8934 | 6748 | 6832 | 12716 | 20540 | 20758.9 |
| 1974 | 29344 | 35374 | 40404 | 33408 | 27145 | 18622 | 11202 | 7598 | 5833 | 6525 | 11681 | 14980 | 20176.3 |
| 1975 | 23260 | 32932 | 37872 | 35646 | 26451 | 18488 | 14313 | 8051 | 5856 | 8951 | 9698 | 19557 | 20089.6 |
| 1976 | 28724 | 36905 | 39502 | 36719 | 28619 | 19484 | 10750 | 6346 | 5379 | 5726 | 9374 | 14022 | 20129.2 |
| 1977 | 26709 | 30961 | 40245 | 37025 | 30653 | 20743 | 13443 | 8878 | 7026 | 8813 | 14375 | 21075 | 21662.2 |
| 1978 | 28799 | 34884 | 40336 | 35483 | 26750 | 19315 | 14017 | 7057 | 4538 | 5449 | 9485 | 22157 | 20689.2 |
| 1979 | 32047 | 37133 | 38795 | 41283 | 35270 | 23191 | 13022 | 7658 | 6153 | 6320 | 7934 | 12393 | 21766.6 |
| 1980 | 21960 | 28162 | 36028 | 36681 | 29903 | 24331 | 14990 | 9497 | 8482 | 9388 | 10315 | 13697 | 20286.2 |
| 1981 | 19749 | 30611 | 37293 | 37230 | 31063 | 25340 | 13435 | 7379 | 5487 | 8162 | 14084 | 21469 | 20941.8 |
| 1982 | 31925 | 38173 | 42784 | 46721 | 39446 | 29404 | 21086 | 12125 | 8082 | 13616 | 19877 | 24151 | 27282.5 |
| 1983 | 27444 | 32907 | 36602 | 33257 | 32509 | 26115 | 22308 | 14546 | 8058 | 6792 | 9820 | 14611 | 22080.8 |
| 1984 | 27096 | 35769 | 41754 | 48878 | 40776 | 28616 | 17933 | 9422 | 6461 | 6691 | 16732 | 22515 | 25220.2 |
| 1985 | 31208 | 35986 | 36644 | 37156 | 35334 | 25425 | 15928 | 11293 | 7576 | 8127 | 11843 | 15888 | 22700.7 |
| 1986 | 24668 | 33481 | 39765 | 42221 | 32628 | 25710 | 16900 | 10468 | 8565 | 9576 | 8279 | 17123 | 22448.7 |
| 1987 | 25435 | 29969 | 27194 | 23450 | 21870 | 13527 | 7833 | 5239 | 3714 | 4706 | 10047 | 20469 | 16121.1 |
| 1988 | 25162 | 30757 | 33201 | 37908 | 29898 | 21429 | 12448 | 5645 | 3447 | 3694 | 5158 | 9345 | 18174.3 |
| 1989 | 21258 | 27583 | 30559 | 29763 | 23557 | 14962 | 9967 | 5537 | 5229 | 4537 | 5867 | 9643 | 15705.2 |
| 1990 | 20671 | 27047 | 27815 | 24120 | 22066 | 18398 | 14195 | 8338 | 5123 | 6137 | 15142 | 21070 | 17510.2 |
| 1991 | 28573 | 32375 | 34215 | 32415 | 25200 | 19375 | 11528 | 6984 | 3999 | 4924 | 9262 | 17169 | 18834.9 |
| 1992 | 31498 | 33310 | 50043 | 39763 | 35036 | 26988 | 22640 | 11425 | 11879 | 14796 | 14597 | 20885 | 26071.7 |
| 1993 | 27540 | 34745 | 37752 | 38473 | 29730 | 19722 | 10543 | 7055 | 6431 | 6273 | 11839 | 18805 | 20742.3 |
| 1994 | 24471 | 30964 | 32043 | 32170 | 24921 | 14566 | 8290 | 5372 | 3282 | 4874 | 12881 | -9999 | -9999 |
| 1995 | 25081 | 27762 | 34502 | 33052 | 23850 | 14325 | 8208 | 6430 | 3366 | 3367 | 4842 | 13044 | 16485.8 |
| 1996 | 18503 | 27291 | 28404 | 30002 | 20292 | 13539 | 7961 | 4090 | 4130 | 5144 | 10925 | 15026 | 15442.2 |
| |
|
|
|
|
|
|
|
|
|
|
|
|
|
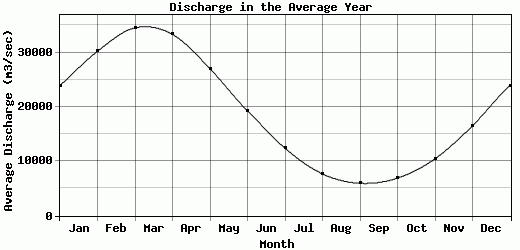
| Avg | 23927.5 | 30215.2 | 34512 | 33316.2 | 26993.4 | 19264.1 | 12394 | 7668.34 | 5958.69 | 6906.93 | 10449.2 | 16524 | 19226.8 |
| |
|
|
|
|
|
|
|
|
|
|
|
|
|
| Std Dev | 6309.48 |
6721.2 |
8074.98 |
8494.45 |
6669.78 |
5597.6 |
4476.74 |
2510.88 |
2048.95 |
2681.03 |
3472.58 |
4325.37 |
4252.32 |
| |
|
|
|
|
|
|
|
|
|
|
|
|
|
| | Jan | Feb | Mar | Apr | May | Jun | Jul | Aug | Sep | Oct | Nov | Dec | Avg Annual |
Click here for this table in tab-delimited format.
Tab-delimited format will open in most table browsing software, i.e. Excel, etc.
View this station on the map.
Return to start.