Results
| Country: | Brasil
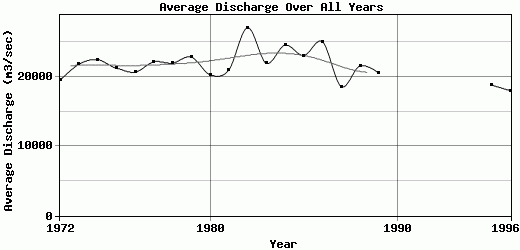
| | Station: | Humaita | | River: | Madeira | | Area: | 1066240 km2 | | Lat: | -7.5 | | Lon: | -63.02 | | Source: | ANEEL | | PointID: | 30 | | Area Units: | km2 | | Discharge Units: | m3/sec | | Starting Year: | 1972 | | Ending Year: | 1996 | | Total Years: | 25 | | Total Usable Years: | 22 | |
| |
| Year | Jan | Feb | Mar | Apr | May | Jun | Jul | Aug | Sep | Oct | Nov | Dec | Avg Annual |
|---|
| 1972 | 20740 | 28119 | 34846 | 35884 | 25390 | 18262 | 10471 | 7932 | 10449 | 11459 | 10533 | 19907 | 19499.3 |
| 1973 | 24394 | 32967 | 38508 | 38793 | 31272 | 22474 | 14430 | 9613 | 7091 | 7196 | 13321 | 21433 | 21791 |
| 1974 | 29948 | 36418 | 42962 | 40385 | 34155 | 23002 | 13728 | 8613 | 6154 | 6413 | 12321 | 15531 | 22469.2 |
| 1975 | 24898 | 35205 | 40028 | 39479 | 30320 | 20263 | 14223 | 8375 | 5379 | 8664 | 9349 | 18835 | 21251.5 |
| 1976 | 28808 | 37472 | 41514 | 39631 | 30199 | 20854 | 11218 | 5944 | 4821 | 5212 | 8700 | 13641 | 20667.8 |
| 1977 | 26907 | 31634 | 40778 | 39352 | 32684 | 21946 | 14124 | 8601 | 6210 | 8407 | 14029 | 21180 | 22154.3 |
| 1978 | 30303 | 36346 | 42032 | 39246 | 30503 | 21538 | 14740 | 7523 | 4466 | 5319 | 9383 | 22181 | 21965 |
| 1979 | 33648 | 39424 | 42029 | 43855 | 37629 | 24861 | 14644 | 7729 | 5671 | 5850 | 7367 | 11381 | 22840.7 |
| 1980 | 20869 | 28026 | 36301 | 38664 | 30700 | 24316 | 15159 | 8857 | 8264 | 8725 | 10121 | 13532 | 20294.5 |
| 1981 | 19508 | 30365 | 37653 | 39274 | 33430 | 26132 | 13488 | 6427 | 4774 | 6924 | 13228 | 20390 | 20966.1 |
| 1982 | 31118 | 39049 | 42807 | 45677 | 41531 | 30187 | 20612 | 12873 | 8158 | 12645 | 17509 | 22459 | 27052.1 |
| 1983 | 26614 | 31699 | 37528 | 37975 | 33552 | 25953 | 21024 | 12360 | 7522 | 6095 | 8844 | 14268 | 21952.8 |
| 1984 | 25024 | 34143 | 40851 | 45404 | 42008 | 29446 | 19575 | 9540 | 6263 | 6068 | 15058 | 21312 | 24557.7 |
| 1985 | 29363 | 35424 | 37003 | 37813 | 36986 | 25999 | 15912 | 11208 | 7655 | 9264 | 13055 | 17202 | 23073.7 |
| 1986 | 27426 | 37162 | 42280 | 45787 | 38085 | 29785 | 19563 | 12033 | 9859 | 10959 | 9670 | 17833 | 25036.8 |
| 1987 | 27893 | 33744 | 32671 | 28391 | 26391 | 15936 | 9647 | 6771 | 4435 | 4423 | 11793 | 21097 | 18599.3 |
| 1988 | 27345 | 32924 | 36606 | 42979 | 37064 | 26830 | 14574 | 7389 | 4020 | 4077 | 9856 | 15401 | 21588.8 |
| 1989 | 25125 | 33608 | 39693 | 37653 | 27954 | 19365 | 13569 | 8537 | 7822 | 7237 | 9266 | 16749 | 20548.2 |
| 1990 | -9999 | -9999 | -9999 | -9999 | -9999 | -9999 | -9999 | -9999 | -9999 | -9999 | -9999 | -9999 | -9999 |
| 1991 | 22984 | 32963 | 41880 | 43510 | 31790 | 24744 | 21126 | -9999 | -9999 | -9999 | -9999 | -9999 | -9999 |
| 1992 | -9999 | -9999 | -9999 | -9999 | -9999 | -9999 | -9999 | -9999 | -9999 | -9999 | -9999 | -9999 | -9999 |
| 1993 | 34136 | 44479 | 49802 | 51137 | -9999 | -9999 | -9999 | 9093 | 7610 | 7219 | 12519 | 20018 | -9999 |
| 1994 | 27861 | 34798 | 38807 | 38071 | -9999 | 18839 | 11329 | 6128 | 4246 | 5735 | 13454 | 16730 | -9999 |
| 1995 | 26741 | 30149 | 37477 | 37846 | 28281 | 17637 | 10588 | 8053 | 3956 | 3923 | 5886 | 15409 | 18828.8 |
| 1996 | 20635 | 30025 | 32871 | 34794 | 24505 | 16442 | 10298 | 5503 | 5169 | 6316 | 12564 | 17113 | 18019.6 |
| |
|
|
|
|
|
|
|
|
|
|
|
|
|
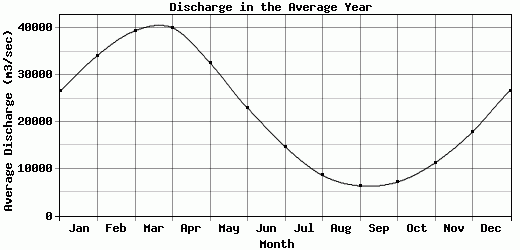
| Avg | 26621.2 | 34180.1 | 39431.6 | 40069.6 | 32591.9 | 22945.9 | 14729.2 | 8595.55 | 6363.36 | 7187.73 | 11264.8 | 17891 | 21657.9 |
| |
|
|
|
|
|
|
|
|
|
|
|
|
|
| Std Dev | 3886.83 |
3788.12 |
3688.5 |
4480.76 |
4803.4 |
4155.35 |
3521.69 |
2002.39 |
1832.94 |
2293.7 |
2661.98 |
3123.05 |
2161.07 |
| |
|
|
|
|
|
|
|
|
|
|
|
|
|
| | Jan | Feb | Mar | Apr | May | Jun | Jul | Aug | Sep | Oct | Nov | Dec | Avg Annual |
Click here for this table in tab-delimited format.
Tab-delimited format will open in most table browsing software, i.e. Excel, etc.
View this station on the map.
Return to start.