Results
| Country: | Brasil
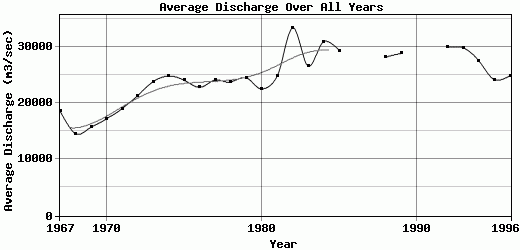
| | Station: | Manicore | | River: | Madeira | | Area: | 1123670 km2 | | Lat: | -5.82 | | Lon: | -61.3 | | Source: | ANEEL | | PointID: | 31 | | Area Units: | km2 | | Discharge Units: | m3/sec | | Starting Year: | 1967 | | Ending Year: | 1996 | | Total Years: | 30 | | Total Usable Years: | 27 | |
| |
| Year | Jan | Feb | Mar | Apr | May | Jun | Jul | Aug | Sep | Oct | Nov | Dec | Avg Annual |
|---|
| 1967 | 25456 | 33204 | 43483 | 34794 | 26533 | 16584 | 11498 | 8332 | 4574 | 2346 | 6518 | 9743 | 18588.8 |
| 1968 | 15144 | 24196 | 32134 | 32116 | 23179 | 11462 | 6312 | 3770 | 4275 | 4058 | 6648 | 10943 | 14519.8 |
| 1969 | 23209 | 27302 | 30335 | 31647 | 24189 | 15396 | 10245 | 4620 | 1717 | 2335 | 5423 | 11903 | 15693.4 |
| 1970 | 16998 | 22744 | 31044 | 34083 | 32647 | 23426 | 14321 | 7766 | 4819 | 4468 | 6039 | 7921 | 17189.7 |
| 1971 | 20091 | 28561 | 35747 | 36454 | 30096 | 18932 | 12683 | 7828 | 5695 | 6503 | 10016 | 15300 | 18992.2 |
| 1972 | 20130 | 29418 | 35578 | 38219 | 34145 | 23851 | 14067 | 10181 | 10364 | 11235 | 9498 | 18693 | 21281.6 |
| 1973 | 24318 | 31017 | 37517 | 40656 | 38259 | 29083 | 19460 | 12927 | 9083 | 7859 | 13448 | 21747 | 23781.2 |
| 1974 | 29143 | 35209 | 41251 | 43691 | 41871 | 31527 | 18826 | 10831 | 7686 | 6944 | 12995 | 17385 | 24779.9 |
| 1975 | 25707 | 35887 | 41133 | 43336 | 38599 | 28247 | 19509 | 11720 | 7111 | 8868 | 9490 | 18924 | 24044.2 |
| 1976 | 28226 | 36438 | 41096 | 44258 | 38490 | 27933 | 15516 | 8013 | 5506 | 5594 | 8523 | 13786 | 22781.6 |
| 1977 | 27636 | 32378 | 38280 | 42771 | 38806 | 29170 | 18535 | 10652 | 7183 | 8307 | 13147 | 21918 | 24065.2 |
| 1978 | 31637 | 35931 | 40945 | 43137 | 36993 | 28128 | 18380 | 9579 | 4757 | 5465 | 10167 | 19683 | 23733.5 |
| 1979 | 32515 | 37230 | 41773 | 46151 | 42796 | 31803 | 16824 | 9991 | 7257 | 6708 | 7903 | 12427 | 24448.2 |
| 1980 | 24063 | 31459 | 36899 | 39885 | 35968 | 28810 | 18666 | 10326 | 8185 | 8276 | 11027 | 16239 | 22483.6 |
| 1981 | 23260 | 35180 | 41034 | 44461 | 39448 | 31973 | 19598 | 9915 | 6776 | 7651 | 15147 | 22901 | 24778.7 |
| 1982 | 34519 | 43520 | 48358 | 52817 | 51969 | 41495 | 30559 | 20746 | 12665 | 15657 | 20691 | 27006 | 33333.5 |
| 1983 | 31676 | 38223 | 41619 | 44797 | 40835 | 33709 | 26156 | 16575 | 9728 | 7632 | 10263 | 17216 | 26535.8 |
| 1984 | 30269 | 38644 | 44816 | 50791 | 52804 | 42485 | 26933 | 14027 | 9473 | 11295 | 22165 | 27152 | 30904.5 |
| 1985 | 34507 | 42592 | 44570 | 45392 | 45994 | 38276 | 23380 | 14833 | 11726 | 13094 | 15313 | 22315 | 29332.7 |
| 1986 | -9999 | -9999 | -9999 | -9999 | -9999 | -9999 | -9999 | -9999 | -9999 | -9999 | -9999 | -9999 | -9999 |
| 1987 | -9999 | -9999 | -9999 | -9999 | -9999 | -9999 | -9999 | -9999 | -9999 | -9999 | -9999 | -9999 | -9999 |
| 1988 | 35135 | 40829 | 45508 | 49875 | 50833 | 39905 | 23484 | 11531 | 5832 | 4762 | 10429 | 19932 | 28171.2 |
| 1989 | 31168 | 43240 | 48254 | 49913 | 46448 | 36200 | 20203 | 14603 | 12039 | 12227 | 13441 | 18133 | 28822.4 |
| 1990 | -9999 | -9999 | -9999 | -9999 | -9999 | -9999 | -9999 | -9999 | -9999 | -9999 | 15199 | 22086 | -9999 |
| 1991 | 31708 | 43042 | -9999 | 48169 | 43389 | 33956 | 26758 | 18173 | 8964 | 7395 | 11259 | 19759 | -9999 |
| 1992 | 29700 | 35345 | 43218 | 47675 | 44088 | 36831 | 30965 | 14233 | 13046 | 18232 | 17468 | 27691 | 29874.3 |
| 1993 | 36001 | 43162 | 49985 | 52581 | 49443 | 34661 | 18507 | 13668 | 10342 | 9430 | 14404 | 25148 | 29777.7 |
| 1994 | 37241 | 43166 | 48197 | 47759 | 42979 | 28014 | 18297 | 12592 | 7670 | 7709 | 14919 | 20939 | 27456.8 |
| 1995 | 32153 | 36879 | 42803 | 45841 | 40615 | 27340 | 15235 | 10759 | 6595 | 4823 | 7569 | 18664 | 24106.3 |
| 1996 | 26366 | 37418 | 42536 | 45396 | 39482 | 25697 | 16709 | 10462 | 8218 | 8675 | 15060 | 22215 | 24852.8 |
| |
|
|
|
|
|
|
|
|
|
|
|
|
|
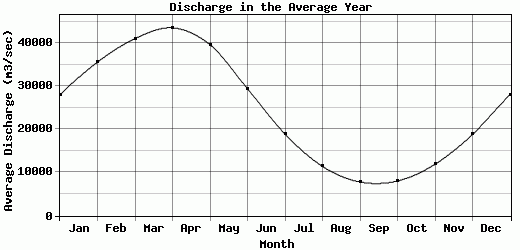
| Avg | 28073.2 | 35637.6 | 41081.3 | 43580.2 | 39662.9 | 29440.5 | 18949.1 | 11431.6 | 7825.41 | 8057.33 | 11934.6 | 18848.9 | 24397.3 |
| |
|
|
|
|
|
|
|
|
|
|
|
|
|
| Std Dev | 5716.74 |
5768.23 |
5149.03 |
5831.7 |
7632.6 |
7639.21 |
5806.83 |
3698.44 |
2739.69 |
3663.73 |
4152.14 |
5117.26 |
4637.27 |
| |
|
|
|
|
|
|
|
|
|
|
|
|
|
| | Jan | Feb | Mar | Apr | May | Jun | Jul | Aug | Sep | Oct | Nov | Dec | Avg Annual |
Click here for this table in tab-delimited format.
Tab-delimited format will open in most table browsing software, i.e. Excel, etc.
View this station on the map.
Return to start.