Results
| Country: | Brasil
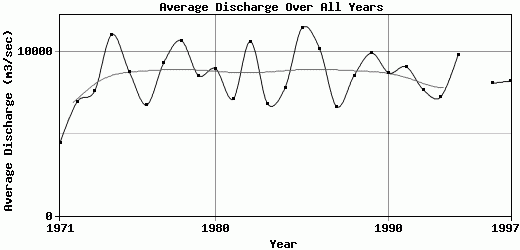
| | Station: | Altamira | | River: | Xingu | | Area: | 446203 km2 | | Lat: | -3.2 | | Lon: | -52.22 | | Source: | ANEEL | | PointID: | 44 | | Area Units: | km2 | | Discharge Units: | m3/sec | | Starting Year: | 1971 | | Ending Year: | 1997 | | Total Years: | 27 | | Total Usable Years: | 26 | |
| |
| Year | Jan | Feb | Mar | Apr | May | Jun | Jul | Aug | Sep | Oct | Nov | Dec | Avg Annual |
|---|
| 1971 | 3440 | 5459 | 6534 | 6625 | 11710 | 6435 | 2851 | 1401 | 885 | 844 | 2818 | 4408 | 4450.83 |
| 1972 | 5880 | 12381 | 17168 | 17582 | 15107 | 6199 | 2858 | 1373 | 959 | 808 | 1170 | 1925 | 6950.83 |
| 1973 | 4621 | 7342 | 14884 | 20465 | 17972 | 7833 | 3911 | 2349 | 1220 | 1515 | 3024 | 5977 | 7592.75 |
| 1974 | 7877 | 15769 | 22603 | 29234 | 27424 | 13956 | 4738 | 2191 | 1549 | 1440 | 1511 | 4329 | 11051.8 |
| 1975 | 7767 | 15925 | 20091 | 21717 | 18760 | 8912 | 4091 | 1988 | 1125 | 871 | 1232 | 3001 | 8790 |
| 1976 | 6800 | 11356 | 16031 | 15566 | 11658 | 5876 | 2632 | 1275 | 913 | 1108 | 2364 | 5427 | 6750.5 |
| 1977 | 9596 | 16180 | 19214 | 18011 | 20175 | 10472 | 4793 | 2101 | 1250 | 1596 | 3507 | 5148 | 9336.92 |
| 1978 | 16278 | 16746 | 27014 | 23844 | 18144 | 9823 | 4459 | 2508 | 1531 | 1566 | 2084 | 4190 | 10682.2 |
| 1979 | 9054 | 19048 | 25793 | 18737 | 11667 | 5430 | 2567 | 1544 | 1486 | 1556 | 2113 | 3565 | 8546.67 |
| 1980 | 8627 | 16136 | 32298 | 22518 | 10959 | 4665 | 2411 | 1504 | 1146 | 1193 | 1674 | 4385 | 8959.67 |
| 1981 | 10759 | 16121 | 13004 | 17540 | 10105 | 4331 | 2235 | 1489 | 1175 | 1047 | 1864 | 5660 | 7110.83 |
| 1982 | 10541 | 24407 | 30091 | 22640 | 18159 | 7572 | 3593 | 1959 | 1399 | 1970 | 2111 | 2892 | 10611.2 |
| 1983 | 6643 | 15677 | 17256 | 17549 | 7928 | 3944 | 2163 | 1443 | 1142 | 1268 | 2490 | 4207 | 6809.17 |
| 1984 | 7244 | 9953 | 14045 | 20193 | 19890 | 7902 | 3281 | 1682 | 1382 | 1465 | 2727 | 3601 | 7780.42 |
| 1985 | 10132 | 23584 | 26133 | 23901 | 24365 | 9947 | 4326 | 2264 | 1418 | 1435 | 2845 | 7110 | 11455 |
| 1986 | 16972 | 19474 | 23591 | 21583 | 15320 | 7041 | 3517 | 1960 | 1524 | 2283 | 4303 | 4571 | 10178.2 |
| 1987 | 7449 | 9026 | 17791 | 18530 | 11020 | 4886 | 2406 | 1443 | 1110 | 1241 | 1541 | 3172 | 6634.58 |
| 1988 | 7570 | 10852 | 20034 | 21675 | 17336 | 7714 | 3492 | 1750 | 1188 | 1236 | 2277 | 7480 | 8550.33 |
| 1989 | 13875 | 14654 | 20933 | 22870 | 13808 | 9140 | 4741 | 2427 | 1635 | 1502 | 3194 | 10229 | 9917.33 |
| 1990 | 18631 | 14065 | 23247 | 18851 | 11230 | 5623 | 2933 | 1991 | 1325 | 1443 | 1996 | 3038 | 8697.75 |
| 1991 | 7967 | 16569 | 17658 | 24281 | 18760 | 9531 | 3933 | 1977 | 1260 | 1306 | 1996 | 3775 | 9084.42 |
| 1992 | 7150 | 14595 | 18215 | 19887 | 12154 | 5191 | 2499 | 1545 | 1267 | 1599 | 2194 | 5687 | 7665.25 |
| 1993 | 9628 | 11578 | 20291 | 16719 | 11430 | 5247 | 2519 | 1509 | 1390 | 1434 | 1929 | 3187 | 7238.42 |
| 1994 | 11571 | 18835 | 24593 | 23544 | 16013 | 7593 | 4695 | 2241 | 1556 | 1446 | 1616 | 3823 | 9793.83 |
| 1995 | 12528 | 18342 | 21175 | 21930 | 22386 | -9999 | -9999 | -9999 | -9999 | 1274 | 1610 | 4602 | -9999 |
| 1996 | 10878 | 12795 | 16866 | 18768 | 17355 | 7071 | 3124 | 1733 | 1224 | 1202 | 2090 | 3827 | 8077.75 |
| 1997 | 7730 | 15708 | 16632 | 23842 | 17407 | 6495 | 3054 | 1705 | 1249 | 1256 | 1359 | 2077 | 8209.5 |
| |
|
|
|
|
|
|
|
|
|
|
|
|
|
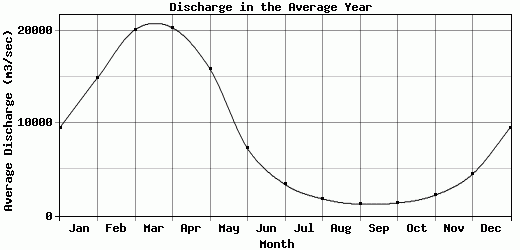
| Avg | 9526.22 | 14910.3 | 20118 | 20318.6 | 15860.8 | 7262.65 | 3377.77 | 1821.23 | 1281.08 | 1366.81 | 2208.85 | 4492.33 | 8497.16 |
| |
|
|
|
|
|
|
|
|
|
|
|
|
|
| Std Dev | 3561.26 |
4311.94 |
5392.95 |
3989.51 |
4626.54 |
2255.04 |
854.91 |
355.88 |
197.05 |
309.54 |
716.96 |
1732.63 |
1597.59 |
| |
|
|
|
|
|
|
|
|
|
|
|
|
|
| | Jan | Feb | Mar | Apr | May | Jun | Jul | Aug | Sep | Oct | Nov | Dec | Avg Annual |
Click here for this table in tab-delimited format.
Tab-delimited format will open in most table browsing software, i.e. Excel, etc.
View this station on the map.
Return to start.