Results
| Country: | Brasil
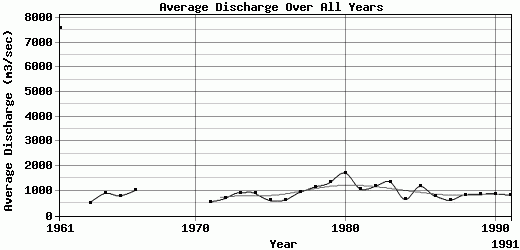
| | Station: | Sao Felix ( A/B ) | | River: | Tocantins | | Area: | 57062 km2 | | Lat: | -13.53 | | Lon: | -48.13 | | Source: | ANEEL | | PointID: | 45 | | Area Units: | km2 | | Discharge Units: | m3/sec | | Starting Year: | 1961 | | Ending Year: | 1991 | | Total Years: | 31 | | Total Usable Years: | 28 | |
| |
| Year | Jan | Feb | Mar | Apr | May | Jun | Jul | Aug | Sep | Oct | Nov | Dec | Avg Annual |
|---|
| 1961 | 3969 | 15708 | 16632 | 23842 | 17407 | 6495 | 3054 | 1705 | 1249 | 173 | 247 | 676 | 7596.42 |
| 1962 | 1056 | 1287 | 1724 | 725 | 478 | 327 | 247 | 186 | 163 | 316 | -9999 | -9999 | -9999 |
| 1963 | 1394 | 1472 | 764 | 553 | 401 | 280 | 219 | 171 | 136 | 122 | 309 | 450 | 522.58 |
| 1964 | 2649 | 2538 | 1119 | 824 | 560 | 363 | 276 | 207 | 142 | 294 | 649 | 1197 | 901.5 |
| 1965 | 1114 | 1248 | 1484 | 1405 | 730 | 473 | 355 | 264 | 194 | 559 | 856 | 936 | 801.5 |
| 1966 | 1170 | 3882 | 2216 | 1085 | 770 | 483 | 368 | 280 | 235 | 403 | 433 | 882 | 1017.25 |
| 1967 | 856 | 1216 | 1274 | 946 | 553 | 376 | 283 | 208 | 156 | 205 | -9999 | -9999 | -9999 |
| 1968 | -9999 | -9999 | -9999 | -9999 | -9999 | -9999 | -9999 | -9999 | -9999 | -9999 | -9999 | -9999 | -9999 |
| 1969 | -9999 | -9999 | -9999 | -9999 | -9999 | -9999 | -9999 | -9999 | -9999 | -9999 | -9999 | -9999 | -9999 |
| 1970 | -9999 | -9999 | -9999 | -9999 | -9999 | 526 | 410 | 324 | 308 | 451 | 806 | 632 | -9999 |
| 1971 | 555 | 590 | 714 | 719 | 395 | 289 | 219 | 181 | 184 | 377 | 1155 | 1281 | 554.92 |
| 1972 | 792 | 874 | 1121 | 974 | 514 | 370 | 290 | 229 | 195 | 445 | 698 | 1830 | 694.33 |
| 1973 | 1233 | 1249 | 1829 | 1627 | 767 | 546 | 415 | 313 | 254 | 776 | 1010 | 1110 | 927.42 |
| 1974 | 963 | 973 | 2391 | 1876 | 990 | 642 | 482 | 381 | 314 | 445 | 571 | 773 | 900.08 |
| 1975 | 824 | 1216 | 776 | 1091 | 558 | 396 | 317 | 253 | 209 | 394 | 650 | 648 | 611 |
| 1976 | 613 | 926 | 1116 | 706 | 504 | 343 | 268 | 218 | 252 | 366 | 870 | 1403 | 632.08 |
| 1977 | 2084 | 2901 | 1028 | 1071 | 662 | 524 | 395 | 312 | 303 | 417 | 532 | 1109 | 944.83 |
| 1978 | 2982 | 2281 | 2595 | 1434 | 850 | 649 | 501 | 388 | 326 | 422 | 516 | 976 | 1160 |
| 1979 | 3470 | 4577 | 2145 | 1366 | 846 | 662 | 511 | 412 | 420 | 391 | 607 | 703 | 1342.5 |
| 1980 | 3048 | 6929 | 2858 | 1888 | 969 | 676 | 535 | 418 | 400 | 341 | 750 | 1930 | 1728.5 |
| 1981 | 2441 | 1251 | 1820 | 1801 | 913 | 691 | 455 | 357 | 345 | 628 | 1303 | 1044 | 1087.42 |
| 1982 | 3723 | 2087 | 2084 | 1333 | 910 | 707 | 552 | 464 | 437 | 544 | 594 | 682 | 1176.42 |
| 1983 | 1878 | 4911 | 1958 | 1596 | 947 | 719 | 575 | 466 | 426 | 529 | 799 | 1539 | 1361.92 |
| 1984 | 1159 | 879 | 1030 | 1165 | 640 | 465 | 374 | 315 | 340 | 439 | 428 | 620 | 654.5 |
| 1985 | 3110 | 2373 | 1719 | 1380 | 857 | 624 | 492 | 399 | 339 | 465 | 617 | 1847 | 1185.17 |
| 1986 | 2137 | 1650 | 1236 | 880 | 638 | 465 | 390 | 351 | 295 | 376 | 389 | 710 | 793.08 |
| 1987 | 833 | 697 | 1179 | 859 | 555 | 390 | 292 | 230 | 209 | 307 | 576 | 1322 | 620.75 |
| 1988 | 1112 | 1352 | 2121 | 1153 | 717 | 560 | 416 | 334 | 262 | 447 | 588 | 1077 | 844.92 |
| 1989 | 1059 | 979 | 896 | 620 | 461 | 344 | 287 | 250 | 249 | 319 | 800 | 4225 | 874.08 |
| 1990 | 2531 | 1572 | 1416 | 996 | 786 | 550 | 462 | 365 | 402 | 409 | 471 | 605 | 880.42 |
| 1991 | 1176 | 1250 | 1936 | 1633 | 796 | 558 | 433 | 349 | 312 | 366 | 505 | 723 | 836.42 |
| |
|
|
|
|
|
|
|
|
|
|
|
|
|
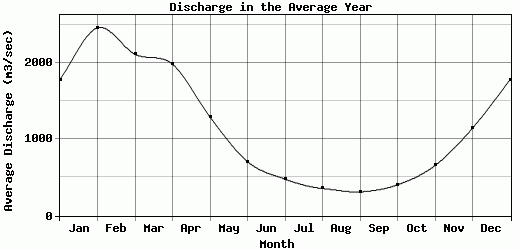
| Avg | 1783.25 | 2459.57 | 2113.61 | 1983.86 | 1291.93 | 706.66 | 478.38 | 356.21 | 312.28 | 404.34 | 656.63 | 1145.56 | 1178.85 |
| |
|
|
|
|
|
|
|
|
|
|
|
|
|
| Std Dev | 1016.03 |
2932.15 |
2852.29 |
4223.52 |
3106.27 |
1101.81 |
497.11 |
268.21 |
197.25 |
128.42 |
238.19 |
725.04 |
1312.95 |
| |
|
|
|
|
|
|
|
|
|
|
|
|
|
| | Jan | Feb | Mar | Apr | May | Jun | Jul | Aug | Sep | Oct | Nov | Dec | Avg Annual |
Click here for this table in tab-delimited format.
Tab-delimited format will open in most table browsing software, i.e. Excel, etc.
View this station on the map.
Return to start.