Results
| Country: | Brasil
| | Station: | Peixe | | River: | Tocantins | | Area: | 130352 km2 | | Lat: | -12.02 | | Lon: | -48.55 | | Source: | ANEEL | | PointID: | 49 | | Area Units: | km2 | | Discharge Units: | m3/sec | | Starting Year: | 1970 | | Ending Year: | 1984 | | Total Years: | 15 | | Total Usable Years: | 14 | |
| |
| Year | Jan | Feb | Mar | Apr | May | Jun | Jul | Aug | Sep | Oct | Nov | Dec | Avg Annual |
|---|
| 1970 | 424 | -9999 | -9999 | -9999 | -9999 | 322 | 274 | 239 | 233 | 263 | 423 | 1374 | -9999 |
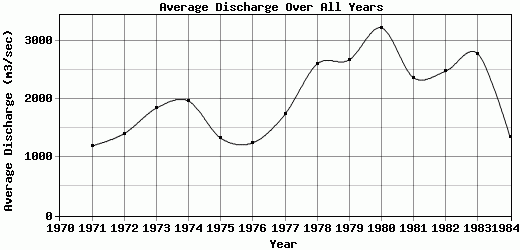
| 1971 | 1092 | 1178 | 1594 | 1571 | 849 | 668 | 506 | 432 | 405 | 707 | 2401 | 2954 | 1196.42 |
| 1972 | 1570 | 1752 | 2541 | 2024 | 992 | 776 | 604 | 499 | 438 | 805 | 1255 | 3601 | 1404.75 |
| 1973 | 2603 | 2406 | 3205 | 3038 | 1374 | 965 | 791 | 588 | 478 | 1355 | 2005 | 3306 | 1842.83 |
| 1974 | 2353 | 2412 | 5101 | 4110 | 2142 | 1199 | 918 | 773 | 671 | 874 | 1255 | 1773 | 1965.08 |
| 1975 | 1964 | 2779 | 1704 | 2414 | 1079 | 808 | 690 | 595 | 502 | 791 | 1387 | 1252 | 1330.42 |
| 1976 | 1145 | 1789 | 2193 | 1281 | 927 | 688 | 581 | 522 | 572 | 799 | 1784 | 2716 | 1249.75 |
| 1977 | 3395 | 5854 | 1773 | 1859 | 1170 | 888 | 718 | 609 | 582 | 786 | 910 | 2287 | 1735.92 |
| 1978 | 5725 | 5211 | 6632 | 3727 | 1772 | 1320 | 983 | 796 | 694 | 866 | 1011 | 2447 | 2598.67 |
| 1979 | 6384 | 9178 | 4228 | 2835 | 1655 | 1228 | 969 | 827 | 840 | 871 | 1460 | 1570 | 2670.42 |
| 1980 | 5339 | 11734 | 5560 | 3294 | 1864 | 1342 | 1065 | 889 | 824 | 811 | 1641 | 4282 | 3220.42 |
| 1981 | 5382 | 2973 | 3489 | 3849 | 1769 | 1377 | 1026 | 860 | 733 | 1145 | 3257 | 2553 | 2367.75 |
| 1982 | 7607 | 5449 | 4576 | 2941 | 1768 | 1347 | 956 | 910 | 788 | 981 | 1171 | 1232 | 2477.17 |
| 1983 | 4147 | 9379 | 4461 | 3545 | 1810 | 1365 | 1090 | 909 | 829 | 902 | 1466 | 3396 | 2774.92 |
| 1984 | 2387 | 1914 | 2227 | 2723 | 1306 | 862 | 731 | 604 | 629 | 769 | 828 | 1217 | 1349.75 |
| |
|
|
|
|
|
|
|
|
|
|
|
|
|
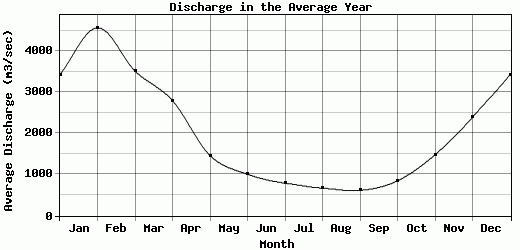
| Avg | 3434.47 | 4572 | 3520.29 | 2800.79 | 1462.64 | 1010.33 | 793.47 | 670.13 | 614.53 | 848.33 | 1483.6 | 2397.33 | 2013.16 |
| |
|
|
|
|
|
|
|
|
|
|
|
|
|
| Std Dev | 2124.05 |
3249.71 |
1544.54 |
845.7 |
397.61 |
315.41 |
227.78 |
193.89 |
173.08 |
223.38 |
667.98 |
947.23 |
642.99 |
| |
|
|
|
|
|
|
|
|
|
|
|
|
|
| | Jan | Feb | Mar | Apr | May | Jun | Jul | Aug | Sep | Oct | Nov | Dec | Avg Annual |
Click here for this table in tab-delimited format.
Tab-delimited format will open in most table browsing software, i.e. Excel, etc.
View this station on the map.
Return to start.