Results
| Country: | Brasil
| | Station: | Porto Nacional | | River: | Tocantins | | Area: | 173828 km2 | | Lat: | -10.7 | | Lon: | -48.43 | | Source: | ANEEL | | PointID: | 50 | | Area Units: | km2 | | Discharge Units: | m3/sec | | Starting Year: | 1949 | | Ending Year: | 1984 | | Total Years: | 36 | | Total Usable Years: | 35 | |
| |
| Year | Jan | Feb | Mar | Apr | May | Jun | Jul | Aug | Sep | Oct | Nov | Dec | Avg Annual |
|---|
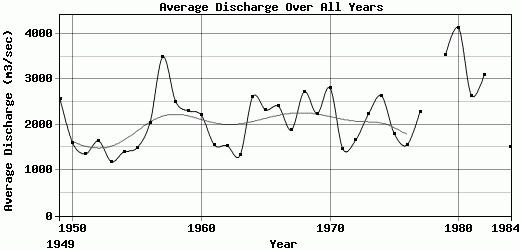
| 1949 | 6235 | 8160 | 5021 | 3180 | 1645 | 991 | 702 | 517 | 397 | 604 | 1274 | 2186 | 2576 |
| 1950 | 2063 | 2377 | 3866 | 2777 | 1438 | 868 | 636 | 506 | 451 | 678 | 1577 | 1861 | 1591.5 |
| 1951 | 2272 | 2030 | 2653 | 2981 | 1277 | 871 | 591 | 458 | 382 | 415 | 435 | 2002 | 1363.92 |
| 1952 | 2091 | 1898 | 5180 | 2578 | 1568 | 785 | 550 | 418 | 399 | 367 | 897 | 2998 | 1644.08 |
| 1953 | 1776 | 1500 | 2054 | 1950 | 866 | 549 | 420 | 346 | 362 | 752 | 985 | 2705 | 1188.75 |
| 1954 | 2418 | 4170 | 2051 | 2392 | 908 | 571 | 427 | 344 | 300 | 278 | 582 | 2460 | 1408.42 |
| 1955 | 2508 | 2944 | 2180 | 2635 | 888 | 564 | 412 | 333 | 282 | 569 | 1170 | 3505 | 1499.17 |
| 1956 | 3381 | 1823 | 4301 | 2165 | 1599 | 885 | 606 | 454 | 359 | 454 | 2941 | 5538 | 2042.17 |
| 1957 | 7449 | 6485 | 8806 | 7457 | 3035 | 1809 | 1228 | 903 | 749 | 806 | 1168 | 2008 | 3491.92 |
| 1958 | 3148 | 7218 | 5114 | 5604 | 2526 | 1292 | 901 | 647 | 570 | 694 | 794 | 1603 | 2509.25 |
| 1959 | 8607 | 4593 | 4902 | 2806 | 1230 | 950 | 722 | 574 | 491 | 630 | 1189 | 1006 | 2308.33 |
| 1960 | 2606 | 4420 | 6053 | 4034 | 1877 | 1190 | 841 | 617 | 460 | 521 | 1089 | 2789 | 2208.08 |
| 1961 | 3957 | 4513 | 3148 | 1291 | 1194 | 822 | 628 | 521 | 425 | 419 | 541 | 1249 | 1559 |
| 1962 | 2239 | 3181 | 3654 | 1813 | 1111 | 669 | 501 | 405 | 360 | 591 | 921 | 3059 | 1542 |
| 1963 | 3166 | 4011 | 2230 | 1434 | 1197 | 658 | 496 | 398 | 348 | 322 | 612 | 1036 | 1325.67 |
| 1964 | 6361 | 7788 | 3872 | 3059 | 1584 | 930 | 669 | 508 | 406 | 735 | 2173 | 3376 | 2621.75 |
| 1965 | 3301 | 3383 | 4581 | 5225 | 2102 | 1191 | 843 | 620 | 481 | 1121 | 1907 | 3212 | 2330.58 |
| 1966 | 3666 | 8008 | 5297 | 3001 | 1817 | 1168 | 845 | 656 | 563 | 814 | 1000 | 2027 | 2405.17 |
| 1967 | 2428 | 4008 | 3839 | 3289 | 1655 | 982 | 706 | 565 | 512 | 544 | 1539 | 2554 | 1885.08 |
| 1968 | 2411 | 5066 | 8358 | 3085 | 1687 | 1081 | 797 | 627 | 571 | 682 | 2670 | 5705 | 2728.33 |
| 1969 | 3501 | 4975 | 4881 | 2222 | 1796 | 983 | 721 | 570 | 502 | 564 | 1613 | 4605 | 2244.42 |
| 1970 | 7662 | 5905 | 7067 | 3430 | 1871 | 1185 | 874 | 682 | 611 | 958 | 1914 | 1586 | 2812.08 |
| 1971 | 1287 | 1498 | 2046 | 2323 | 1129 | 716 | 524 | 441 | 412 | 729 | 2744 | 3780 | 1469.08 |
| 1972 | 2041 | 2385 | 3182 | 2681 | 1203 | 822 | 623 | 512 | 449 | 822 | 1295 | 3932 | 1662.25 |
| 1973 | 3238 | 2995 | 3980 | 4179 | 1959 | 1074 | 803 | 597 | 497 | 1379 | 2280 | 3878 | 2238.25 |
| 1974 | 3075 | 3628 | 6768 | 5992 | 3240 | 1635 | 1054 | 805 | 681 | 949 | 1517 | 2319 | 2638.58 |
| 1975 | 2693 | 3992 | 3009 | 3571 | 1661 | 933 | 709 | 614 | 506 | 807 | 1541 | 1634 | 1805.83 |
| 1976 | 1501 | 2380 | 3009 | 1781 | 1223 | 745 | 629 | 528 | 573 | 985 | 2035 | 3311 | 1558.33 |
| 1977 | 3839 | 8168 | 2734 | 2680 | 1815 | 1210 | 847 | 652 | 592 | 949 | 1089 | 2850 | 2285.42 |
| 1978 | 7634 | 7667 | 9476 | -9999 | -9999 | 1822 | 1305 | 955 | 774 | -9999 | 1186 | 3104 | -9999 |
| 1979 | 8337 | 12371 | 5994 | 4089 | 2169 | 1585 | 1182 | 930 | 976 | 981 | 1880 | 1993 | 3540.58 |
| 1980 | 6003 | 16866 | 8805 | 4112 | 2059 | 1396 | 1084 | 944 | 847 | 870 | 1731 | 4915 | 4136 |
| 1981 | 6872 | 3616 | 3926 | 5043 | 1826 | 1319 | 953 | 745 | 603 | 939 | 3260 | 2617 | 2643.25 |
| 1982 | 9707 | 7544 | 5863 | 4060 | 2120 | 1498 | 1103 | 977 | 829 | 1064 | 1220 | 1246 | 3102.58 |
| 1983 | 4350 | 9883 | 5068 | 4206 | 1936 | 1470 | 1140 | 913 | 844 | 904 | 1558 | -9999 | -9999 |
| 1984 | 2695 | 2045 | 2561 | 3392 | 1443 | 909 | 759 | 619 | 640 | 794 | 858 | 1315 | 1502.5 |
| |
|
|
|
|
|
|
|
|
|
|
|
|
|
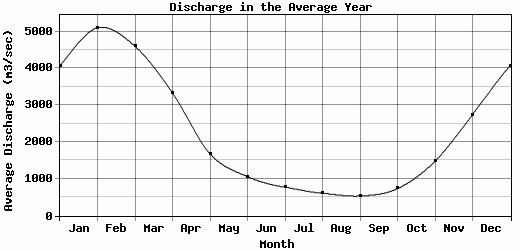
| Avg | 4069.94 | 5097.06 | 4598.03 | 3329.06 | 1675.83 | 1059.11 | 773.08 | 608.36 | 533.44 | 734 | 1477.36 | 2741.83 | 2172.6 |
| |
|
|
|
|
|
|
|
|
|
|
|
|
|
| Std Dev | 2291.06 |
3256.42 |
2016.72 |
1323.28 |
533.42 |
336.7 |
233.83 |
181.71 |
167.22 |
241.68 |
681.37 |
1198.3 |
700.23 |
| |
|
|
|
|
|
|
|
|
|
|
|
|
|
| | Jan | Feb | Mar | Apr | May | Jun | Jul | Aug | Sep | Oct | Nov | Dec | Avg Annual |
Click here for this table in tab-delimited format.
Tab-delimited format will open in most table browsing software, i.e. Excel, etc.
View this station on the map.
Return to start.