Results
| Country: | Brasil
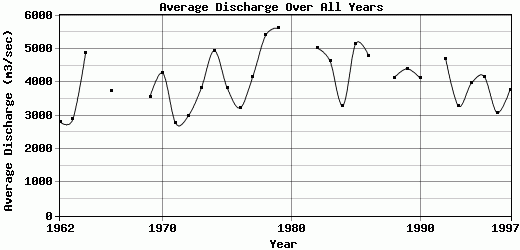
| | Station: | Carolina | | River: | Tocantins | | Area: | 276520 km2 | | Lat: | -7.33 | | Lon: | -47.47 | | Source: | ANEEL | | PointID: | 54 | | Area Units: | km2 | | Discharge Units: | m3/sec | | Starting Year: | 1962 | | Ending Year: | 1997 | | Total Years: | 36 | | Total Usable Years: | 34 | |
| |
| Year | Jan | Feb | Mar | Apr | May | Jun | Jul | Aug | Sep | Oct | Nov | Dec | Avg Annual |
|---|
| 1962 | 3515 | 5289 | 6934 | 3903 | 2371 | 1493 | 1143 | 966 | 880 | 1162 | 1867 | 4270 | 2816.08 |
| 1963 | 5222 | 6860 | 5323 | 4034 | 3246 | 1852 | 1402 | 1035 | 917 | 885 | 1470 | 2397 | 2886.92 |
| 1964 | 10115 | 15517 | 8083 | 6108 | 3478 | 2114 | 1505 | 1236 | 1022 | 1386 | 2605 | 5437 | 4883.83 |
| 1965 | 4896 | 5518 | -9999 | -9999 | 4131 | 2282 | 1702 | 1331 | 1087 | 1842 | 2730 | 4252 | -9999 |
| 1966 | 5027 | 10881 | 8246 | 5185 | 2967 | 2065 | 1511 | 1215 | 1144 | 1419 | 1757 | 3316 | 3727.75 |
| 1967 | 4086 | -9999 | 7382 | 8004 | 3591 | 2010 | 1511 | 1204 | 1083 | 1086 | 2445 | 3625 | -9999 |
| 1968 | 4520 | 7668 | 13615 | 5394 | 3440 | 2143 | 1569 | 1293 | 1104 | 1269 | -9999 | 7968 | -9999 |
| 1969 | 5262 | 7167 | 7868 | 4507 | 3320 | 1820 | 1374 | 1138 | 1047 | 1196 | 2386 | 5597 | 3556.83 |
| 1970 | 10165 | 8869 | 11008 | 5148 | 3133 | 2016 | 1547 | 1262 | 1159 | 1684 | 2390 | 2844 | 4268.75 |
| 1971 | 2672 | 3182 | 3916 | 5064 | 2806 | 1666 | 1270 | 1095 | 1005 | 1538 | 3711 | 5292 | 2768.08 |
| 1972 | 3816 | 5055 | 5789 | 5167 | 2427 | 1709 | 1328 | 1158 | 1058 | 1473 | 2072 | 4923 | 2997.92 |
| 1973 | 5443 | 4800 | 7062 | 7352 | 3544 | 2116 | 1654 | 1342 | 1108 | 2268 | 3584 | 5662 | 3827.92 |
| 1974 | 5426 | 6709 | 11527 | 11067 | 6836 | 3276 | 2224 | 1739 | 1506 | 1903 | 2975 | 4124 | 4942.67 |
| 1975 | 5236 | 7398 | 6644 | 8579 | 3965 | 2329 | 1850 | 1388 | 1158 | 1529 | 2744 | 3209 | 3835.75 |
| 1976 | 3456 | 5365 | 6223 | 4589 | 3020 | 1907 | 1364 | 1122 | 1109 | 2039 | 3395 | 5123 | 3226 |
| 1977 | 5778 | 12124 | 5439 | 5684 | 4993 | 2650 | 1797 | 1371 | 1258 | 1944 | 2512 | 4399 | 4162.42 |
| 1978 | 10797 | 10308 | 13754 | 8003 | 4965 | 3185 | 2244 | 1720 | 1477 | 1864 | 2066 | 4451 | 5402.83 |
| 1979 | 11237 | 18450 | 10191 | 7147 | 4004 | 2648 | 1987 | 1652 | 1748 | 1864 | 3138 | 3444 | 5625.83 |
| 1980 | 9181 | -9999 | -9999 | 7148 | -9999 | -9999 | 2042 | 1709 | 1579 | 1661 | 3086 | 8115 | -9999 |
| 1981 | 10504 | 7082 | 7976 | 9491 | 3534 | 2636 | -9999 | -9999 | -9999 | -9999 | 5122 | 4614 | -9999 |
| 1982 | 12891 | 11220 | 9283 | 7491 | 4087 | 2851 | 1935 | 1744 | 1666 | 2011 | 2415 | 2659 | 5021.08 |
| 1983 | 6458 | 14218 | 7771 | 6292 | 3326 | 2404 | 1829 | 1529 | 1354 | 1795 | 2731 | 5862 | 4630.75 |
| 1984 | 5799 | 4546 | 5544 | 7585 | 3703 | 2179 | 1523 | 1303 | 1337 | 1565 | 1939 | 2553 | 3298 |
| 1985 | 7549 | 10691 | 8476 | 8866 | 5269 | 2967 | 2162 | 1663 | 1382 | 2238 | 3501 | 7044 | 5150.67 |
| 1986 | 12663 | 9545 | 8774 | 6523 | 4584 | 2688 | 2028 | 1648 | 1436 | 2282 | 2372 | 3047 | 4799.17 |
| 1987 | 4237 | 3765 | 6907 | 6415 | 3326 | 1922 | 1395 | 1132 | 975 | 1314 | 2200 | -9999 | -9999 |
| 1988 | 6467 | 6566 | 9999 | 6631 | 3867 | 2407 | 1719 | 1313 | 1080 | 1478 | 2342 | 5766 | 4136.25 |
| 1989 | 5744 | 5664 | 6819 | 6245 | 4458 | 2349 | 1711 | 1339 | 1205 | 1379 | 3351 | 12554 | 4401.5 |
| 1990 | 12660 | 6515 | 7896 | 5543 | 3730 | 2398 | 1852 | 1394 | 1443 | 1455 | 1828 | 2798 | 4126 |
| 1991 | 5855 | 6533 | 7633 | -9999 | -9999 | -9999 | -9999 | -9999 | -9999 | 1381 | 2212 | 3405 | -9999 |
| 1992 | 5962 | 15197 | 6112 | 5868 | 3549 | 2189 | 1660 | 1302 | 1248 | 1605 | 3315 | 8430 | 4703.08 |
| 1993 | 6760 | 6870 | 6028 | 4772 | 3074 | 1909 | 1454 | 1185 | 1137 | 1483 | 1525 | 3168 | 3280.42 |
| 1994 | 6992 | 6391 | 10153 | 7609 | 3381 | 2372 | 1807 | 1335 | 1073 | 1137 | 1738 | 3607 | 3966.25 |
| 1995 | 5397 | 7197 | 6024 | 8727 | 6323 | 3137 | 2041 | 1469 | 1143 | 1262 | 2077 | 5173 | 4164.17 |
| 1996 | 6045 | 4329 | 5542 | 5669 | 3647 | 2104 | 1465 | 1143 | 954 | 1392 | 2151 | 2552 | 3082.75 |
| 1997 | 5969 | 5210 | 8949 | 9079 | 4710 | 2340 | 1590 | 1163 | 1036 | 1153 | 1401 | 2610 | 3767.5 |
| |
|
|
|
|
|
|
|
|
|
|
|
|
|
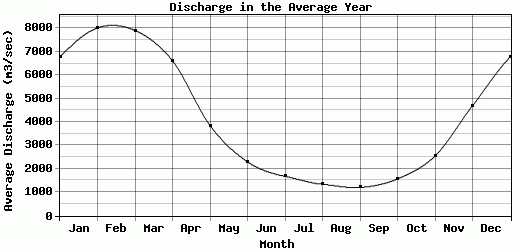
| Avg | 6772.28 | 8020.56 | 7908.53 | 6614.38 | 3847.21 | 2298.03 | 1682.21 | 1342.29 | 1203.47 | 1569.77 | 2547.23 | 4694 | 4050.25 |
| |
|
|
|
|
|
|
|
|
|
|
|
|
|
| Std Dev | 2772.96 |
3608 |
2246.8 |
1674.88 |
961.8 |
433.73 |
280.89 |
214.65 |
214.04 |
348.45 |
760.15 |
2103.19 |
797.03 |
| |
|
|
|
|
|
|
|
|
|
|
|
|
|
| | Jan | Feb | Mar | Apr | May | Jun | Jul | Aug | Sep | Oct | Nov | Dec | Avg Annual |
Click here for this table in tab-delimited format.
Tab-delimited format will open in most table browsing software, i.e. Excel, etc.
View this station on the map.
Return to start.