Results
| Country: | Brasil
| | Station: | Tocantinopolis | | River: | Tocantins | | Area: | 290570 km2 | | Lat: | -6.32 | | Lon: | -47.42 | | Source: | ANEEL | | PointID: | 55 | | Area Units: | km2 | | Discharge Units: | m3/sec | | Starting Year: | 1955 | | Ending Year: | 1981 | | Total Years: | 27 | | Total Usable Years: | 24 | |
| |
| Year | Jan | Feb | Mar | Apr | May | Jun | Jul | Aug | Sep | Oct | Nov | Dec | Avg Annual |
|---|
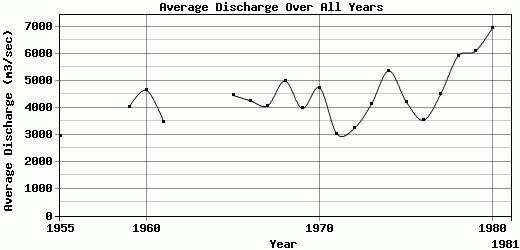
| 1955 | 4544 | 6201 | 4596 | 5650 | 2382 | 1576 | 1068 | 794 | 637 | 1006 | 2348 | 4711 | 2959.42 |
| 1956 | 6065 | 3329 | 8168 | 5123 | -9999 | -9999 | -9999 | -9999 | 1496 | 1658 | 7466 | 14462 | -9999 |
| 1957 | 22462 | 17504 | 21539 | 20609 | -9999 | -9999 | -9999 | -9999 | -9999 | -9999 | -9999 | -9999 | -9999 |
| 1958 | -9999 | 10436 | 7795 | -9999 | -9999 | -9999 | -9999 | -9999 | -9999 | 1570 | 1925 | 2282 | -9999 |
| 1959 | 11671 | 9059 | 8099 | 5093 | 2664 | 1981 | 1553 | 1304 | 1097 | 1409 | 2176 | 2190 | 4024.67 |
| 1960 | 5084 | 10205 | 13080 | 8758 | 3684 | 2381 | 1805 | 1414 | 1160 | 1303 | 2141 | 4738 | 4646.08 |
| 1961 | 7086 | 9532 | 7658 | 4601 | 3024 | 1880 | 1395 | 1189 | 996 | 859 | 1229 | 2177 | 3468.83 |
| 1962 | 3749 | 5901 | 7616 | -9999 | -9999 | 1677 | 1242 | 1113 | 1082 | 1246 | 2018 | 4485 | -9999 |
| 1963 | -9999 | -9999 | 6044 | -9999 | 3701 | 1897 | 1425 | 1114 | 938 | 910 | 1546 | 2460 | -9999 |
| 1964 | -9999 | 14092 | 9188 | 6996 | -9999 | -9999 | -9999 | -9999 | -9999 | -9999 | -9999 | -9999 | -9999 |
| 1965 | 5312 | 6172 | 8873 | 10986 | 4801 | 2625 | 1967 | 1591 | 1349 | 2008 | 2927 | 4899 | 4459.17 |
| 1966 | 6130 | 12136 | 9417 | 6216 | 3265 | 2310 | 1725 | 1327 | 1209 | 1469 | 2139 | 3742 | 4257.08 |
| 1967 | 4911 | 6760 | 8739 | 9028 | 4506 | 2503 | 1792 | 1461 | 1244 | 1320 | 2649 | 3910 | 4068.58 |
| 1968 | 5360 | 8170 | 14959 | 6205 | 3891 | 2399 | 1808 | 1475 | 1307 | 1491 | 3733 | 9016 | 4984.5 |
| 1969 | 5920 | 8050 | 9021 | 5012 | 3638 | 2190 | 1623 | 1287 | 1163 | 1314 | 2559 | 5883 | 3971.67 |
| 1970 | 11086 | 9819 | 11979 | 5689 | 3488 | 2259 | 1735 | 1383 | 1263 | 1853 | 3109 | 3121 | 4732 |
| 1971 | 2952 | 3506 | 4351 | 5726 | 3182 | 1877 | 1391 | 1168 | 1057 | 1618 | 3767 | 5761 | 3029.67 |
| 1972 | 4059 | 5552 | 6418 | 5758 | 2627 | 1891 | 1430 | 1236 | 1101 | 1541 | 2126 | 5020 | 3229.92 |
| 1973 | 6041 | 5019 | 7661 | 8126 | 3825 | 2356 | 1824 | 1469 | 1192 | 2309 | 3605 | 6175 | 4133.5 |
| 1974 | 5906 | 7347 | 12287 | 12275 | 7768 | 3541 | 2428 | 1901 | 1652 | 2009 | 3058 | 4168 | 5361.67 |
| 1975 | 5657 | 8176 | 7293 | 9474 | 4606 | 2612 | 2127 | 1612 | 1314 | 1709 | 2820 | 3370 | 4230.83 |
| 1976 | 3648 | 6305 | 6760 | 5130 | 3335 | 2118 | 1567 | 1294 | 1240 | 2182 | 3483 | 5360 | 3535.17 |
| 1977 | 5912 | 13101 | 6122 | 6196 | 5663 | 2813 | 1991 | 1558 | 1401 | 2097 | 2540 | 4624 | 4501.5 |
| 1978 | 11798 | 10855 | 15676 | 8894 | 5605 | 3359 | 2403 | 1906 | 1608 | 1957 | 2180 | 4679 | 5910 |
| 1979 | 11855 | 19691 | 11279 | 7947 | 4456 | 2870 | 2213 | 1856 | 1970 | 2026 | 3293 | 3640 | 6091.33 |
| 1980 | 9571 | 22384 | 16689 | 7986 | 4268 | 2889 | 2328 | 1881 | 1743 | 1875 | 3285 | 8614 | 6959.42 |
| 1981 | 11326 | 8059 | 8337 | 10504 | -9999 | -9999 | -9999 | 1744 | 1441 | 1875 | 5345 | 5047 | -9999 |
| |
|
|
|
|
|
|
|
|
|
|
|
|
|
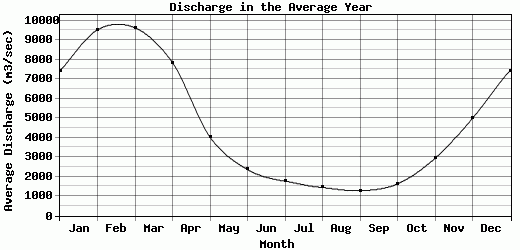
| Avg | 7421.04 | 9513.88 | 9616.44 | 7832.58 | 4018.05 | 2363.82 | 1765.45 | 1438.13 | 1277.5 | 1624.56 | 2938.68 | 4981.36 | 4427.75 |
| |
|
|
|
|
|
|
|
|
|
|
|
|
|
| Std Dev | 4181.33 |
4612.11 |
3894.49 |
3376.22 |
1207.01 |
500.76 |
367.15 |
283.41 |
276.87 |
388.25 |
1252.43 |
2557.02 |
1015.34 |
| |
|
|
|
|
|
|
|
|
|
|
|
|
|
| | Jan | Feb | Mar | Apr | May | Jun | Jul | Aug | Sep | Oct | Nov | Dec | Avg Annual |
Click here for this table in tab-delimited format.
Tab-delimited format will open in most table browsing software, i.e. Excel, etc.
View this station on the map.
Return to start.