Results
| Country: | Brasil
| | Station: | Boca do Guariba | | River: | Aripuana | | Area: | 47773 km2 | | Lat: | -7.68 | | Lon: | -60.3 | | Source: | ANEEL | | PointID: | 81 | | Area Units: | km2 | | Discharge Units: | m3/sec | | Starting Year: | 1969 | | Ending Year: | 1997 | | Total Years: | 29 | | Total Usable Years: | 28 | |
| |
| Year | Jan | Feb | Mar | Apr | May | Jun | Jul | Aug | Sep | Oct | Nov | Dec | Avg Annual |
|---|
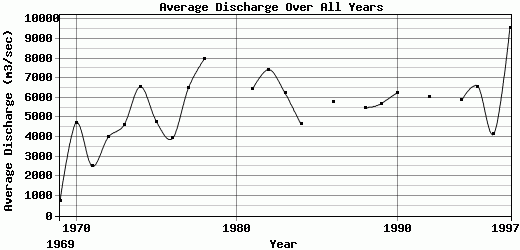
| 1969 | 511 | 521 | 1013 | 1064 | 714 | 211 | 95 | 48 | 581 | 609 | 976 | 2298 | 720.08 |
| 1970 | 4947 | 9200 | 13367 | 12925 | 6947 | 2410 | 1224 | 804 | 666 | 1091 | 1459 | 1582 | 4718.5 |
| 1971 | 1784 | 2830 | 4364 | 6344 | 4272 | 1732 | 959 | 654 | 519 | 706 | 2053 | 3959 | 2514.67 |
| 1972 | 5984 | 7974 | 10645 | 9147 | 4964 | 1950 | 1050 | 824 | 689 | 697 | 1179 | 2773 | 3989.67 |
| 1973 | 6217 | 6942 | 8877 | 10937 | 8134 | 3003 | 1541 | 998 | 757 | 1077 | 2416 | 4681 | 4631.67 |
| 1974 | 6263 | 9520 | 12496 | 15990 | 16926 | 6637 | 2571 | 1407 | 1083 | 1218 | 1653 | 3060 | 6568.67 |
| 1975 | 6018 | 9109 | 9478 | 11198 | 10093 | 3454 | 1604 | 1035 | 742 | 741 | 1246 | 2667 | 4782.08 |
| 1976 | 3977 | 5429 | 8038 | 9014 | 5863 | 2874 | 1410 | 935 | 765 | 1257 | 2222 | 5404 | 3932.33 |
| 1977 | 8556 | 12169 | 16243 | 12788 | 11272 | 5050 | 2229 | 1283 | 997 | 1302 | 2067 | 4204 | 6513.33 |
| 1978 | 11229 | 14105 | 21102 | 19764 | 12841 | 5858 | 2413 | 1535 | 1138 | 1135 | 1647 | 3302 | 8005.75 |
| 1979 | 7870 | 17169 | -9999 | -9999 | -9999 | 3743 | 1873 | 1317 | 1404 | 1560 | 2162 | 3572 | -9999 |
| 1980 | 6618 | 15444 | -9999 | -9999 | 11345 | 4253 | 2178 | 1445 | 1164 | 1216 | 1526 | 4241 | -9999 |
| 1981 | 9843 | 13464 | 12947 | 13895 | 10678 | 4009 | 2009 | 1351 | 1057 | 1021 | 2274 | 5088 | 6469.67 |
| 1982 | 8136 | 15338 | 18789 | 18331 | 11900 | 5526 | 2547 | 1560 | 1409 | 1627 | 1765 | 2334 | 7438.5 |
| 1983 | 4901 | 12262 | 15699 | 16924 | 8941 | 3620 | 1865 | 1340 | 1078 | 1251 | 2334 | 4668 | 6240.25 |
| 1984 | 7973 | 7744 | 7427 | 11256 | 9116 | 3286 | 1592 | 1090 | 1060 | 1084 | 1497 | 2589 | 4642.83 |
| 1985 | 5937 | 12906 | 16155 | 16922 | 8941 | 5386 | -9999 | -9999 | 1018 | 1191 | 2005 | 4043 | -9999 |
| 1986 | 9693 | 12844 | 14276 | 12658 | 8445 | 3058 | 1499 | 1032 | 1035 | 1272 | 1631 | 2075 | 5793.17 |
| 1987 | 4243 | 5827 | 7738 | 9495 | 5756 | 2262 | 1307 | 959 | -9999 | 920 | -9999 | -9999 | -9999 |
| 1988 | 6783 | 8561 | 10976 | 13740 | 10491 | 4165 | 1860 | 1208 | 938 | 1075 | 1758 | 4344 | 5491.58 |
| 1989 | 7262 | 8758 | 11280 | 13203 | 9639 | 3785 | 1934 | 1306 | 1095 | 1080 | 2355 | 6835 | 5711 |
| 1990 | 13573 | 14517 | 15135 | 12957 | 7216 | 3259 | 1703 | 1154 | 1003 | 1169 | 1487 | 2017 | 6265.83 |
| 1991 | 4430 | 8536 | 11224 | 14313 | 13608 | 5563 | 2115 | 1302 | -9999 | 1142 | 1676 | 3359 | -9999 |
| 1992 | 5196 | 12174 | 15323 | 14496 | 9341 | 3746 | 1804 | 1202 | 1063 | 1325 | 2085 | 4995 | 6062.5 |
| 1993 | 7968 | 9674 | -9999 | 10661 | 6287 | 2633 | 1503 | 1083 | 1016 | 1207 | 1414 | 2283 | -9999 |
| 1994 | 7010 | 12406 | 13619 | 14729 | 8786 | 3474 | 1972 | 1285 | 968 | 966 | 1293 | 3964 | 5872.67 |
| 1995 | 7825 | 12319 | 13525 | 14038 | 12811 | 6836 | 2505 | 1432 | 1021 | 1056 | 1630 | 3938 | 6578 |
| 1996 | 6549 | 7366 | 8120 | 9000 | 6866 | 3010 | 1519 | 1038 | 881 | 987 | 1697 | 3008 | 4170.08 |
| 1997 | 6376 | 12720 | 19598 | 31070 | 23762 | 7644 | 3776 | 2040 | 1468 | 1524 | 1635 | 3130 | 9561.92 |
| |
|
|
|
|
|
|
|
|
|
|
|
|
|
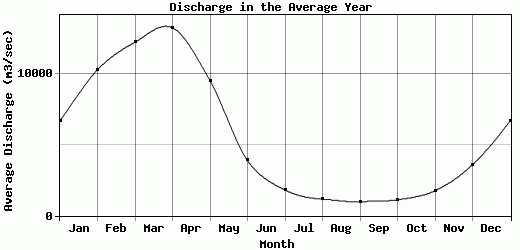
| Avg | 6678.34 | 10269.9 | 12209.8 | 13217 | 9498.39 | 3877.14 | 1809.18 | 1166.68 | 985.74 | 1120.9 | 1755.07 | 3586.18 | 5507.6 |
| |
|
|
|
|
|
|
|
|
|
|
|
|
|
| Std Dev | 2560.49 |
3800.6 |
4546.56 |
5129.93 |
4218.26 |
1622.9 |
648.56 |
346.77 |
230.95 |
237.85 |
379.18 |
1189.36 |
1786.52 |
| |
|
|
|
|
|
|
|
|
|
|
|
|
|
| | Jan | Feb | Mar | Apr | May | Jun | Jul | Aug | Sep | Oct | Nov | Dec | Avg Annual |
Click here for this table in tab-delimited format.
Tab-delimited format will open in most table browsing software, i.e. Excel, etc.
View this station on the map.
Return to start.