Results
| Country: | Brasil
| | Station: | Santarem Sucunduri | | River: | Sucunduri | | Area: | 13938 km2 | | Lat: | -6.75 | | Lon: | -58.95 | | Source: | ANEEL | | PointID: | 82 | | Area Units: | km2 | | Discharge Units: | m3/sec | | Starting Year: | 1973 | | Ending Year: | 1994 | | Total Years: | 22 | | Total Usable Years: | 21 | |
| |
| Year | Jan | Feb | Mar | Apr | May | Jun | Jul | Aug | Sep | Oct | Nov | Dec | Avg Annual |
|---|
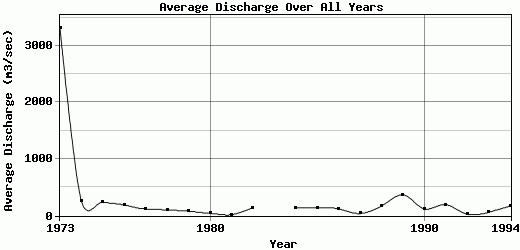
| 1973 | 6376 | 12720 | 19598 | 64 | 248 | 239 | 147 | 99 | 92 | 74 | 33 | 83 | 3314.42 |
| 1974 | 84 | 429 | 523 | 372 | 437 | 497 | 328 | 177 | 91 | 68 | 34 | 27 | 255.58 |
| 1975 | 39 | 72 | 120 | 508 | 718 | 556 | 366 | 208 | 128 | 65 | 36 | 38 | 237.83 |
| 1976 | 48 | 122 | 425 | 510 | 430 | 286 | 235 | 110 | 49 | 24 | 15 | 10 | 188.67 |
| 1977 | 13 | 31 | 93 | 243 | 376 | 323 | 177 | 76 | 41 | 23 | 10 | 6 | 117.67 |
| 1978 | 26 | 21 | 76 | 325 | 392 | 167 | 82 | 47 | 35 | 40 | 3 | 2 | 101.33 |
| 1979 | 3 | 15 | 98 | 137 | 226 | 237 | 98 | 44 | 44 | 20 | 18 | 14 | 79.5 |
| 1980 | 17 | 15 | 41 | 116 | 92 | 126 | 51 | 22 | 8 | 2 | 10 | 2 | 41.83 |
| 1981 | 1 | 9 | 9 | 16 | 51 | 36 | 35 | 22 | 14 | 9 | 2 | 1 | 17.08 |
| 1982 | 12 | 236 | 202 | 436 | 417 | 230 | 105 | 37 | 11 | 2 | 0 | 0 | 140.67 |
| 1983 | -9999 | 3 | 5 | 12 | 19 | 8 | 3 | 2 | 1 | 0 | -9999 | -9999 | -9999 |
| 1984 | 6 | 12 | 119 | 229 | 653 | 279 | 153 | 73 | 74 | 21 | 10 | 4 | 136.08 |
| 1985 | 14 | 29 | 146 | 104 | 658 | 346 | 136 | 98 | 46 | 15 | 18 | 47 | 138.08 |
| 1986 | 35 | 66 | 101 | 321 | 346 | 272 | 183 | 68 | 27 | 20 | 11 | 4 | 121.17 |
| 1987 | 8 | 5 | 27 | 88 | 167 | 82 | 36 | 29 | 14 | 7 | 3 | 0 | 38.83 |
| 1988 | 1 | 37 | 135 | 149 | 601 | 463 | 339 | 125 | 77 | 43 | 17 | 37 | 168.67 |
| 1989 | 76 | 183 | 536 | 679 | 839 | 742 | 477 | 321 | 203 | 182 | 119 | 59 | 368 |
| 1990 | 59 | 96 | 196 | 278 | 281 | 190 | 149 | 105 | 49 | 21 | 8 | 8 | 120 |
| 1991 | 38 | 106 | 182 | 445 | 534 | 513 | 240 | 144 | 71 | 31 | 16 | 7 | 193.92 |
| 1992 | 4 | 13 | 74 | 125 | 65 | 35 | 19 | 14 | 5 | 1 | 1 | 0 | 29.67 |
| 1993 | 7 | 40 | 102 | 148 | 210 | 105 | 53 | 21 | 6 | 3 | 6 | 4 | 58.75 |
| 1994 | 27 | 93 | 289 | 416 | 470 | 292 | 260 | 91 | 39 | 36 | 10 | 5 | 169 |
| |
|
|
|
|
|
|
|
|
|
|
|
|
|
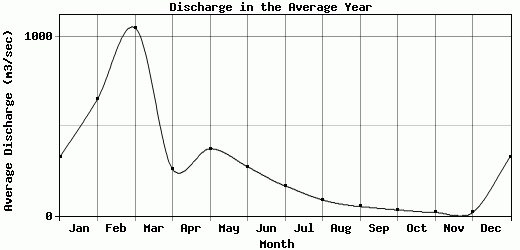
| Avg | 328.29 | 652.41 | 1049.86 | 260.05 | 374.09 | 273.82 | 166.91 | 87.86 | 51.14 | 32.14 | 18.1 | 17.05 | 287.46 |
| |
|
|
|
|
|
|
|
|
|
|
|
|
|
| Std Dev | 1352.52 |
2635.14 |
4050.2 |
178.82 |
224.72 |
183.91 |
123.9 |
73.44 |
46.66 |
39.08 |
24.77 |
22.41 |
681.82 |
| |
|
|
|
|
|
|
|
|
|
|
|
|
|
| | Jan | Feb | Mar | Apr | May | Jun | Jul | Aug | Sep | Oct | Nov | Dec | Avg Annual |
Click here for this table in tab-delimited format.
Tab-delimited format will open in most table browsing software, i.e. Excel, etc.
View this station on the map.
Return to start.