Results
| Country: | Brasil
| | Station: | Porto Roncador | | River: | Teles Pires | | Area: | 9514 km2 | | Lat: | -13.58 | | Lon: | -55.32 | | Source: | ANEEL | | PointID: | 85 | | Area Units: | km2 | | Discharge Units: | m3/sec | | Starting Year: | 1973 | | Ending Year: | 1994 | | Total Years: | 22 | | Total Usable Years: | 14 | |
| |
| Year | Jan | Feb | Mar | Apr | May | Jun | Jul | Aug | Sep | Oct | Nov | Dec | Avg Annual |
|---|
| 1973 | 449 | 712 | 657 | 593 | 320 | 166 | 129 | -9999 | 57 | 67 | 90 | -9999 | -9999 |
| 1974 | -9999 | 125 | 161 | 152 | 120 | 93 | 77 | 67 | 64 | 77 | 82 | 108 | -9999 |
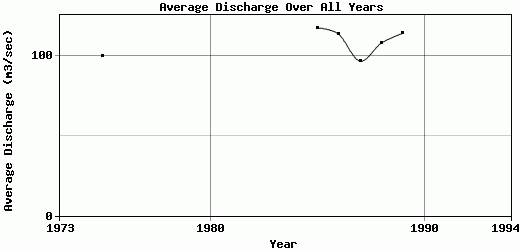
| 1975 | 120 | 132 | 131 | 153 | 109 | 86 | 77 | 66 | 60 | 69 | 84 | 111 | 99.83 |
| 1976 | 109 | 157 | 175 | 134 | 113 | 101 | 79 | 66 | 65 | -9999 | -9999 | 117 | -9999 |
| 1977 | 151 | 152 | -9999 | 133 | 137 | 121 | 86 | 73 | 75 | 86 | 103 | 141 | -9999 |
| 1978 | 182 | 166 | -9999 | 160 | -9999 | -9999 | -9999 | -9999 | -9999 | -9999 | 112 | 146 | -9999 |
| 1979 | 222 | 269 | 210 | 170 | 138 | -9999 | 100 | 88 | -9999 | -9999 | -9999 | -9999 | -9999 |
| 1980 | -9999 | -9999 | -9999 | -9999 | -9999 | 116 | 101 | 88 | -9999 | -9999 | 102 | -9999 | -9999 |
| 1981 | 227 | -9999 | -9999 | 208 | 155 | -9999 | -9999 | -9999 | -9999 | -9999 | -9999 | -9999 | -9999 |
| 1982 | -9999 | -9999 | -9999 | -9999 | -9999 | -9999 | -9999 | -9999 | -9999 | -9999 | -9999 | -9999 | -9999 |
| 1983 | -9999 | -9999 | -9999 | -9999 | -9999 | -9999 | -9999 | -9999 | -9999 | -9999 | -9999 | -9999 | -9999 |
| 1984 | -9999 | -9999 | -9999 | -9999 | -9999 | -9999 | -9999 | -9999 | -9999 | -9999 | -9999 | 124 | -9999 |
| 1985 | 151 | 146 | 176 | 170 | 122 | 100 | 88 | 77 | 77 | 100 | 108 | 93 | 117.33 |
| 1986 | 147 | 160 | 193 | 137 | 110 | 94 | 83 | 78 | 77 | 87 | 91 | 104 | 113.42 |
| 1987 | 120 | 139 | 134 | 124 | 100 | 81 | 69 | 64 | 60 | 66 | 83 | 119 | 96.58 |
| 1988 | 130 | 149 | 184 | 149 | 113 | 92 | 79 | 69 | 63 | 70 | 91 | 105 | 107.83 |
| 1989 | 129 | 164 | 156 | 134 | 135 | 103 | 89 | 81 | 76 | 75 | 92 | 133 | 113.92 |
| 1990 | 169 | 169 | 169 | 149 | 129 | 101 | 93 | -9999 | -9999 | -9999 | -9999 | -9999 | -9999 |
| 1991 | -9999 | -9999 | -9999 | -9999 | -9999 | -9999 | -9999 | -9999 | -9999 | -9999 | -9999 | -9999 | -9999 |
| 1992 | -9999 | -9999 | -9999 | -9999 | -9999 | 114 | 98 | 86 | 96 | 94 | 103 | 123 | -9999 |
| 1993 | 133 | 136 | 131 | -9999 | 101 | 88 | 75 | 69 | 65 | 67 | 83 | 104 | -9999 |
| 1994 | 167 | 150 | 191 | -9999 | 105 | 100 | 88 | 75 | 68 | 79 | 95 | 125 | -9999 |
| |
|
|
|
|
|
|
|
|
|
|
|
|
|
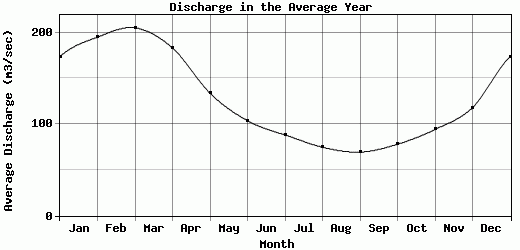
| Avg | 173.73 | 195.07 | 205.23 | 183.29 | 133.8 | 103.73 | 88.19 | 74.79 | 69.46 | 78.08 | 94.21 | 118.07 | 108.15 |
| |
|
|
|
|
|
|
|
|
|
|
|
|
|
| Std Dev | 80.98 |
141.84 |
132.57 |
115.47 |
52.02 |
19.83 |
13.88 |
8.15 |
10.15 |
10.9 |
9.53 |
14.6 |
7.62 |
| |
|
|
|
|
|
|
|
|
|
|
|
|
|
| | Jan | Feb | Mar | Apr | May | Jun | Jul | Aug | Sep | Oct | Nov | Dec | Avg Annual |
Click here for this table in tab-delimited format.
Tab-delimited format will open in most table browsing software, i.e. Excel, etc.
View this station on the map.
Return to start.