Results
| Country: | Brasil
| | Station: | Fazenda Paquira | | River: | Paru de Este | | Area: | 30945 km2 | | Lat: | -0.42 | | Lon: | -53.72 | | Source: | ANEEL | | PointID: | 91 | | Area Units: | km2 | | Discharge Units: | m3/sec | | Starting Year: | 1966 | | Ending Year: | 1988 | | Total Years: | 23 | | Total Usable Years: | 23 | |
| |
| Year | Jan | Feb | Mar | Apr | May | Jun | Jul | Aug | Sep | Oct | Nov | Dec | Avg Annual |
|---|
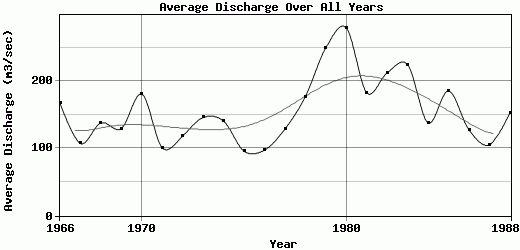
| 1966 | 194 | 596 | 350 | 172 | 133 | 88 | 70 | 54 | 46 | 78 | 79 | 147 | 167.25 |
| 1967 | 153 | 205 | 206 | 175 | 107 | 63 | 47 | 36 | 34 | 39 | 79 | 144 | 107.33 |
| 1968 | 111 | 326 | 352 | 168 | 92 | 68 | 50 | 40 | 39 | 63 | 120 | 228 | 138.08 |
| 1969 | 140 | 298 | 223 | 104 | 89 | 58 | 43 | 33 | 28 | 46 | 210 | 282 | 129.5 |
| 1970 | 491 | 427 | 384 | 175 | 108 | 79 | 66 | 51 | 55 | 80 | 138 | 115 | 180.75 |
| 1971 | 155 | 151 | 100 | 102 | 54 | 39 | 27 | 24 | 29 | 86 | 196 | 248 | 100.92 |
| 1972 | 121 | 122 | 150 | 153 | 84 | 61 | 48 | 38 | 34 | 90 | 161 | 359 | 118.42 |
| 1973 | 177 | 209 | 285 | 216 | 116 | 88 | 70 | 55 | 50 | 157 | 168 | 161 | 146 |
| 1974 | 122 | 120 | 434 | 276 | 146 | 100 | 82 | 68 | 56 | 71 | 96 | 116 | 140.58 |
| 1975 | 130 | 159 | 112 | 175 | 84 | 60 | 48 | 38 | 34 | 78 | 118 | 115 | 95.92 |
| 1976 | 101 | 142 | 145 | 99 | 72 | 48 | 37 | 30 | 44 | 46 | 139 | 268 | 97.58 |
| 1977 | 298 | 333 | 139 | 157 | 94 | 75 | 58 | 47 | 47 | 63 | 84 | 152 | 128.92 |
| 1978 | 475 | 326 | 385 | 194 | 124 | 100 | 80 | 64 | 55 | 82 | 84 | 157 | 177.17 |
| 1979 | 840 | 708 | 337 | 249 | 148 | 118 | 99 | 87 | 85 | 86 | 108 | 130 | 249.58 |
| 1980 | 486 | 938 | 426 | 271 | 181 | 141 | 113 | 91 | 96 | 81 | 188 | 340 | 279.33 |
| 1981 | 369 | 164 | 305 | 283 | 154 | 136 | 102 | 77 | 64 | 128 | 231 | 180 | 182.75 |
| 1982 | 656 | 303 | 324 | 262 | 166 | 130 | 107 | 97 | 107 | 122 | 143 | 133 | 212.5 |
| 1983 | 375 | 695 | 354 | 243 | 171 | 134 | 111 | 37 | 40 | 65 | 136 | 331 | 224.33 |
| 1984 | 229 | 192 | 201 | 249 | 122 | 97 | 81 | 74 | 81 | 112 | 100 | 118 | 138 |
| 1985 | 467 | 274 | 227 | 247 | 157 | 107 | 88 | 78 | 71 | 93 | 121 | 296 | 185.5 |
| 1986 | 298 | 254 | 177 | 127 | 105 | 86 | 76 | 70 | 61 | 70 | 70 | 134 | 127.33 |
| 1987 | 110 | 125 | 193 | 132 | 80 | 61 | 50 | 42 | 39 | 57 | 120 | 256 | 105.42 |
| 1988 | 199 | 266 | 371 | 193 | 122 | 106 | 79 | 69 | 59 | 91 | 110 | 168 | 152.75 |
| |
|
|
|
|
|
|
|
|
|
|
|
|
|
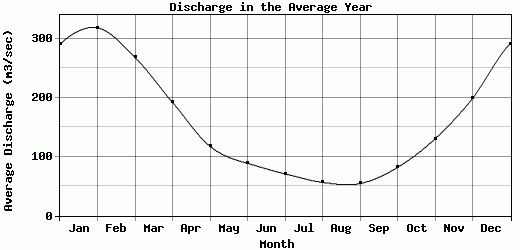
| Avg | 291.17 | 318.83 | 268.7 | 192.26 | 117.78 | 88.83 | 70.96 | 56.52 | 54.52 | 81.91 | 130.39 | 199.04 | 155.91 |
| |
|
|
|
|
|
|
|
|
|
|
|
|
|
| Std Dev | 194.54 |
212.72 |
103.25 |
57.52 |
33.83 |
29.01 |
24.38 |
20.73 |
20.96 |
27.12 |
43.47 |
79.08 |
48.57 |
| |
|
|
|
|
|
|
|
|
|
|
|
|
|
| | Jan | Feb | Mar | Apr | May | Jun | Jul | Aug | Sep | Oct | Nov | Dec | Avg Annual |
Click here for this table in tab-delimited format.
Tab-delimited format will open in most table browsing software, i.e. Excel, etc.
View this station on the map.
Return to start.