Results
| Country: | Brasil
| | Station: | Porto Gilandia | | River: | 1 Balsas | | Area: | 7735 km2 | | Lat: | -10.73 | | Lon: | -47.8 | | Source: | ANEEL | | PointID: | 111 | | Area Units: | km2 | | Discharge Units: | m3/sec | | Starting Year: | 1973 | | Ending Year: | 1997 | | Total Years: | 25 | | Total Usable Years: | 24 | |
| |
| Year | Jan | Feb | Mar | Apr | May | Jun | Jul | Aug | Sep | Oct | Nov | Dec | Avg Annual |
|---|
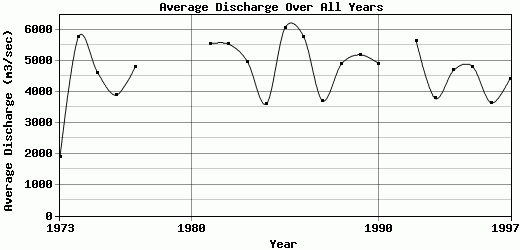
| 1973 | 261 | 197 | 278 | 297 | 174 | 2677 | 2107 | 1678 | 1349 | 2660 | 4208 | 6639 | 1877.08 |
| 1974 | 6388 | 7792 | 12729 | 12640 | 8340 | 4089 | 2724 | 2155 | 1875 | 2287 | 3569 | 4680 | 5772.33 |
| 1975 | 6109 | 8505 | 7709 | 9731 | 5250 | 3008 | 2418 | 1815 | 1477 | 1946 | 3346 | 4001 | 4609.58 |
| 1976 | 4336 | 6844 | 7207 | 5611 | 3611 | 2267 | 1706 | 1454 | 1401 | 2518 | 3866 | 5794 | 3884.58 |
| 1977 | 6320 | 13230 | 6520 | 6573 | 6104 | 3014 | 2061 | 1622 | 1478 | 2426 | 2942 | 5114 | 4783.67 |
| 1978 | 11872 | 10979 | 16173 | 9100 | -9999 | -9999 | 2794 | 2188 | 1864 | 2249 | 2567 | 5138 | -9999 |
| 1979 | 11901 | 20063 | 11338 | 8126 | -9999 | 3280 | 2479 | 2068 | 2230 | 2304 | 3753 | 4130 | -9999 |
| 1980 | 9707 | -9999 | -9999 | 8023 | 4616 | 3217 | 2569 | 2077 | 2012 | 2079 | 3665 | 8636 | -9999 |
| 1981 | 11355 | 8414 | 8562 | 10875 | 4352 | 3269 | 2447 | 1971 | 1650 | 2168 | 5736 | 5593 | 5532.67 |
| 1982 | 14096 | 13194 | 10082 | 8097 | 4334 | 3003 | 2150 | 1918 | 1844 | 2201 | 2584 | 2786 | 5524.08 |
| 1983 | 6962 | 15572 | 8209 | 6548 | 3503 | 2552 | 1993 | 1692 | 1512 | 1959 | 2899 | 6063 | 4955.33 |
| 1984 | 6131 | 4736 | 5989 | 8608 | 4172 | 2399 | 1600 | 1454 | 1498 | 1628 | 2177 | 2760 | 3596 |
| 1985 | 8605 | 13943 | 9894 | 10885 | 6180 | 3259 | 2402 | 1856 | 1553 | 2396 | 3758 | 7863 | 6049.5 |
| 1986 | 16781 | 11296 | 10743 | 7609 | 5445 | 3097 | 2276 | 1850 | 1673 | 2532 | 2607 | 3187 | 5758 |
| 1987 | 4611 | 3949 | 7946 | 7517 | 3682 | 2206 | 1676 | 1411 | 1249 | 1588 | 2400 | 6233 | 3705.67 |
| 1988 | 7182 | 7351 | 12299 | 8200 | 4574 | 2817 | 2007 | 1636 | 1392 | 1751 | 2760 | 6517 | 4873.83 |
| 1989 | 6478 | 6415 | 7926 | 7469 | 5304 | 2771 | 2090 | 1712 | 1564 | 1703 | 3838 | 14922 | 5182.67 |
| 1990 | 16038 | 7315 | 9369 | 6468 | 4118 | 2692 | 2195 | 1598 | 1784 | 1850 | 2179 | 3185 | 4899.25 |
| 1991 | 6532 | 7333 | 8832 | -9999 | -9999 | -9999 | -9999 | -9999 | -9999 | 1800 | 2542 | 3850 | -9999 |
| 1992 | 6427 | 20782 | 7021 | 6767 | 3986 | 2517 | 1971 | 1585 | 1564 | 1914 | 3682 | 9226 | 5620.17 |
| 1993 | 7860 | 7731 | 7020 | 5367 | 3552 | 2224 | 1730 | 1447 | 1410 | 1765 | 1825 | 3464 | 3782.92 |
| 1994 | 8316 | 7399 | 12313 | 9085 | 3857 | 2725 | 2130 | 1644 | 1368 | 1466 | 2004 | 3898 | 4683.75 |
| 1995 | 6138 | 8299 | 6803 | 10246 | 7462 | 3590 | 2323 | 1767 | 1416 | 1567 | 2331 | 5721 | 4805.25 |
| 1996 | 7034 | 4888 | 6528 | 6845 | 4300 | 2466 | 1762 | 1437 | 1245 | 1688 | 2454 | 2914 | 3630.08 |
| 1997 | 6798 | 6155 | 10547 | 11235 | 5354 | 2578 | 1821 | 1411 | 1276 | 1397 | 1661 | 2762 | 4416.25 |
| |
|
|
|
|
|
|
|
|
|
|
|
|
|
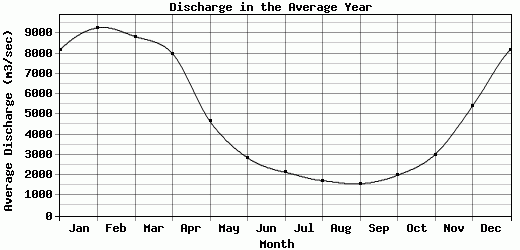
| Avg | 8169.52 | 9265.92 | 8834.88 | 7996.75 | 4648.64 | 2857.26 | 2142.96 | 1726.92 | 1570.17 | 1993.68 | 3014.12 | 5403.04 | 4663.94 |
| |
|
|
|
|
|
|
|
|
|
|
|
|
|
| Std Dev | 3659.8 |
4762.59 |
3011.24 |
2427.6 |
1571.99 |
453.45 |
325.87 |
237.15 |
247.37 |
355.39 |
901.18 |
2649.13 |
965.71 |
| |
|
|
|
|
|
|
|
|
|
|
|
|
|
| | Jan | Feb | Mar | Apr | May | Jun | Jul | Aug | Sep | Oct | Nov | Dec | Avg Annual |
Click here for this table in tab-delimited format.
Tab-delimited format will open in most table browsing software, i.e. Excel, etc.
View this station on the map.
Return to start.