Results
| Country: | Brasil
| | Station: | Itaguatins | | River: | 6 Tocantins | | Area: | 298689 km2 | | Lat: | -5.72 | | Lon: | -47.5 | | Source: | ANEEL | | PointID: | 116 | | Area Units: | km2 | | Discharge Units: | m3/sec | | Starting Year: | 1968 | | Ending Year: | 1997 | | Total Years: | 30 | | Total Usable Years: | 27 | |
| |
| Year | Jan | Feb | Mar | Apr | May | Jun | Jul | Aug | Sep | Oct | Nov | Dec | Avg Annual |
|---|
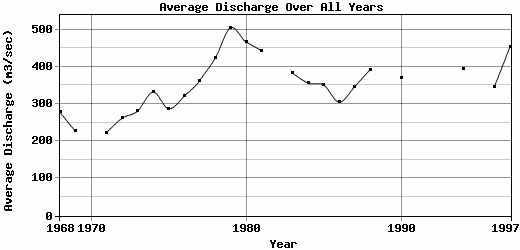
| 1968 | 286 | 601 | 503 | 336 | 251 | 184 | 183 | 166 | 154 | 174 | 205 | 285 | 277.33 |
| 1969 | 321 | 349 | 312 | 252 | 209 | 174 | 160 | 150 | 145 | 161 | 212 | 270 | 226.25 |
| 1970 | 333 | 509 | -9999 | 376 | 258 | -9999 | -9999 | -9999 | -9999 | -9999 | -9999 | 202 | -9999 |
| 1971 | 233 | 267 | 366 | 302 | 225 | 184 | 155 | 145 | 140 | 166 | 233 | 261 | 223.08 |
| 1972 | 300 | 487 | 344 | 300 | 202 | 178 | 168 | 156 | 152 | 179 | 269 | 401 | 261.33 |
| 1973 | 369 | 428 | 403 | 356 | 267 | 210 | 182 | 166 | 160 | 198 | 288 | 342 | 280.75 |
| 1974 | 510 | 388 | 646 | 476 | 363 | 270 | 221 | 194 | 183 | 209 | 229 | 292 | 331.75 |
| 1975 | 343 | 369 | 392 | 443 | 296 | 218 | 196 | 173 | 163 | 181 | 274 | 399 | 287.25 |
| 1976 | 328 | 480 | 485 | 355 | 312 | 259 | 206 | 175 | 183 | 217 | 332 | 514 | 320.5 |
| 1977 | 500 | 612 | 448 | 414 | 377 | 287 | 235 | 195 | 201 | 248 | 343 | 489 | 362.42 |
| 1978 | 724 | 513 | 743 | 458 | 419 | 344 | 272 | 241 | 244 | 270 | 334 | 509 | 422.58 |
| 1979 | 1001 | 966 | 812 | 596 | 436 | 347 | 296 | 258 | 301 | 272 | 344 | 422 | 504.25 |
| 1980 | 644 | 1001 | 816 | 525 | 413 | 331 | 293 | 251 | 263 | 250 | 315 | 492 | 466.17 |
| 1981 | 747 | 517 | 729 | 585 | 408 | 319 | 287 | 246 | 225 | 273 | 469 | 508 | 442.75 |
| 1982 | 753 | 665 | 718 | 635 | 414 | 347 | 288 | 271 | 286 | 304 | -9999 | -9999 | -9999 |
| 1983 | 606 | 566 | 476 | 451 | 343 | 302 | 242 | 224 | 215 | 263 | 353 | 548 | 382.42 |
| 1984 | 489 | 462 | 477 | 439 | 351 | 283 | 226 | 221 | 224 | 270 | 323 | 506 | 355.92 |
| 1985 | 687 | 455 | 550 | 488 | 350 | 274 | 244 | 213 | 206 | 219 | 255 | 266 | 350.58 |
| 1986 | 437 | 476 | 390 | 341 | 285 | 226 | 191 | 220 | 223 | 229 | 233 | 406 | 304.75 |
| 1987 | 461 | 436 | 477 | 431 | 354 | 266 | 230 | 210 | 203 | 211 | 299 | 585 | 346.92 |
| 1988 | 543 | 571 | 726 | 532 | 385 | 319 | 271 | 240 | 220 | 238 | 275 | 389 | 392.42 |
| 1989 | 586 | 645 | 640 | -9999 | -9999 | -9999 | -9999 | -9999 | -9999 | -9999 | -9999 | -9999 | -9999 |
| 1990 | 544 | 541 | 502 | 431 | 366 | 291 | 266 | 232 | 251 | 317 | 317 | 377 | 369.58 |
| 1991 | 491 | 624 | 749 | 582 | 393 | 319 | 278 | 247 | -9999 | -9999 | -9999 | -9999 | -9999 |
| 1992 | -9999 | -9999 | -9999 | -9999 | -9999 | -9999 | -9999 | -9999 | 313 | 313 | 389 | 506 | -9999 |
| 1993 | -9999 | -9999 | -9999 | -9999 | -9999 | -9999 | 264 | 250 | 249 | 272 | 266 | 425 | -9999 |
| 1994 | 619 | 481 | 647 | 486 | 369 | 312 | 280 | 245 | 223 | 243 | 349 | 472 | 393.83 |
| 1995 | 750 | 872 | 578 | 632 | 522 | -9999 | -9999 | 270 | 242 | 283 | -9999 | 353 | -9999 |
| 1996 | 446 | 452 | 438 | 426 | 337 | 304 | 256 | 237 | 243 | 237 | 392 | 384 | 346 |
| 1997 | 627 | 671 | 706 | 560 | 409 | 440 | 318 | 264 | 249 | 272 | 336 | 583 | 452.92 |
| |
|
|
|
|
|
|
|
|
|
|
|
|
|
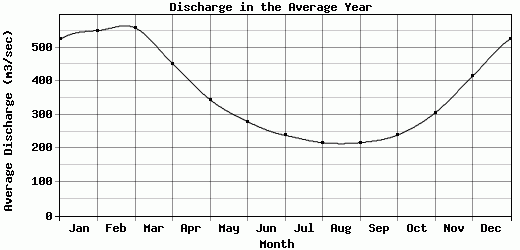
| Avg | 524.21 | 550.14 | 558.26 | 452.15 | 344.96 | 279.52 | 238.77 | 217.04 | 217.07 | 239.59 | 305.36 | 414.3 | 352.25 |
| |
|
|
|
|
|
|
|
|
|
|
|
|
|
| Std Dev | 177.06 |
167.62 |
150.36 |
103.05 |
75.02 |
63.44 |
45.85 |
38.28 |
45.92 |
43.8 |
61.36 |
103.74 |
73.29 |
| |
|
|
|
|
|
|
|
|
|
|
|
|
|
| | Jan | Feb | Mar | Apr | May | Jun | Jul | Aug | Sep | Oct | Nov | Dec | Avg Annual |
Click here for this table in tab-delimited format.
Tab-delimited format will open in most table browsing software, i.e. Excel, etc.
View this station on the map.
Return to start.