Results
| Country: | Brasil
| | Station: | | | River: | 9 Rio Cristalino | | Area: | 8039 km2 | | Lat: | -12.9 | | Lon: | -50.85 | | Source: | ANEEL | | PointID: | 119 | | Area Units: | km2 | | Discharge Units: | m3/sec | | Starting Year: | 1969 | | Ending Year: | 1997 | | Total Years: | 29 | | Total Usable Years: | 25 | |
| |
| Year | Jan | Feb | Mar | Apr | May | Jun | Jul | Aug | Sep | Oct | Nov | Dec | Avg Annual |
|---|
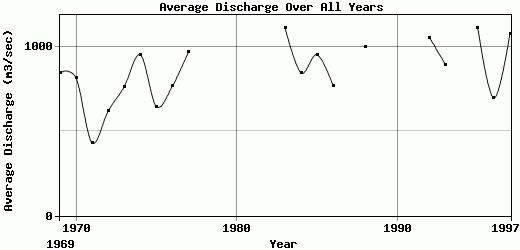
| 1969 | 1298 | 1511 | 1804 | 1466 | 837 | 771 | 532 | 419 | 218 | 246 | 382 | 712 | 849.67 |
| 1970 | 1391 | 1797 | 2324 | 1151 | 730 | 428 | 347 | 288 | 269 | 320 | 368 | 375 | 815.67 |
| 1971 | 398 | 444 | 646 | 706 | 474 | 328 | 261 | 235 | 218 | 277 | 529 | 666 | 431.83 |
| 1972 | 706 | 1325 | 1499 | 903 | 480 | 360 | 292 | 257 | 230 | 287 | 396 | 710 | 620.42 |
| 1973 | 1206 | 1155 | 1370 | 1473 | 765 | 458 | 355 | 294 | 263 | 348 | 581 | 918 | 765.5 |
| 1974 | 1395 | 1367 | 1736 | 2178 | 1333 | 708 | 503 | 403 | 350 | 383 | 465 | 621 | 953.5 |
| 1975 | 908 | 1054 | 930 | 1126 | 759 | 450 | 373 | 321 | 288 | 274 | 446 | 836 | 647.08 |
| 1976 | 807 | 1017 | 1553 | 1128 | 697 | 480 | 381 | 326 | 298 | 383 | 640 | 1519 | 769.08 |
| 1977 | 1533 | 2443 | 1425 | 1278 | 947 | 667 | 524 | 422 | 396 | 469 | 596 | 966 | 972.17 |
| 1978 | 2183 | 1818 | 2671 | 1626 | 1104 | 808 | -9999 | 556 | 442 | 456 | 611 | 1043 | -9999 |
| 1979 | 2027 | 3084 | 2264 | -9999 | -9999 | -9999 | -9999 | 531 | 555 | 547 | 599 | 734 | -9999 |
| 1980 | -9999 | -9999 | -9999 | -9999 | -9999 | -9999 | -9999 | -9999 | 472 | 469 | 590 | 1095 | -9999 |
| 1981 | -9999 | -9999 | 1617 | -9999 | -9999 | -9999 | 579 | 482 | 420 | 483 | 811 | 1177 | -9999 |
| 1982 | 1544 | 2427 | 1984 | -9999 | -9999 | -9999 | 631 | 521 | 513 | 576 | 622 | -9999 | -9999 |
| 1983 | 1319 | 2503 | 1889 | 1718 | 1065 | 838 | 586 | 456 | 412 | 497 | 684 | 1403 | 1114.17 |
| 1984 | 1731 | 1162 | 1261 | 1491 | 869 | 566 | 445 | 390 | 421 | 419 | 508 | 899 | 846.83 |
| 1985 | 1496 | 1861 | 1733 | 1757 | 1088 | 642 | 487 | 408 | 364 | 425 | 594 | 604 | 954.92 |
| 1986 | 1369 | 1536 | 1537 | 973 | 678 | 475 | 390 | 368 | 410 | 413 | 461 | 635 | 770.42 |
| 1987 | 1378 | 1249 | 1456 | 1274 | 769 | 509 | 401 | 345 | 325 | 335 | 488 | -9999 | -9999 |
| 1988 | 1716 | 1351 | 2352 | 1772 | 1136 | 682 | 522 | 442 | 385 | 395 | 489 | 761 | 1000.25 |
| 1989 | 1272 | 1529 | 1789 | 1447 | -9999 | -9999 | -9999 | -9999 | -9999 | 378 | 591 | 1316 | -9999 |
| 1990 | 2217 | 1492 | 1813 | 1442 | 945 | 600 | -9999 | -9999 | -9999 | -9999 | -9999 | -9999 | -9999 |
| 1991 | -9999 | -9999 | -9999 | -9999 | -9999 | -9999 | -9999 | -9999 | -9999 | -9999 | 546 | 707 | -9999 |
| 1992 | 1222 | 2014 | 1746 | 1846 | 1273 | 674 | 510 | 431 | 471 | 536 | 725 | 1223 | 1055.92 |
| 1993 | 1572 | 1665 | 2001 | 1242 | 748 | 572 | 467 | 410 | 397 | 424 | 453 | 762 | 892.75 |
| 1994 | 2186 | 1930 | -9999 | -9999 | 951 | 645 | 537 | 452 | 377 | 369 | 697 | 1162 | -9999 |
| 1995 | 1893 | 2078 | 1916 | 1758 | 1538 | 825 | 610 | 489 | 421 | 486 | 534 | 806 | 1112.83 |
| 1996 | 1206 | 1015 | 1070 | 951 | 707 | 556 | 422 | 367 | 362 | 374 | 601 | 728 | 696.58 |
| 1997 | 1198 | 1942 | 1935 | 2190 | 1260 | 864 | 680 | 498 | 432 | 437 | 523 | 1018 | 1081.42 |
| |
|
|
|
|
|
|
|
|
|
|
|
|
|
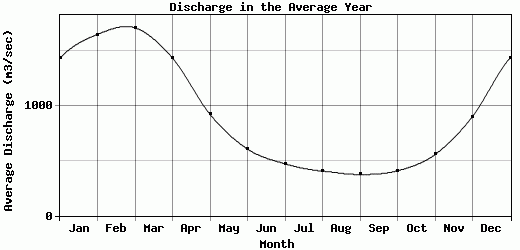
| Avg | 1429.65 | 1644.96 | 1704.65 | 1430.26 | 919.7 | 604.61 | 471.09 | 404.44 | 373.42 | 407.63 | 554.64 | 899.85 | 860.58 |
| |
|
|
|
|
|
|
|
|
|
|
|
|
|
| Std Dev | 441.17 |
561.4 |
440.83 |
381.91 |
265.3 |
151.39 |
107.75 |
84.35 |
87.41 |
84.44 |
103.37 |
271.69 |
178.77 |
| |
|
|
|
|
|
|
|
|
|
|
|
|
|
| | Jan | Feb | Mar | Apr | May | Jun | Jul | Aug | Sep | Oct | Nov | Dec | Avg Annual |
Click here for this table in tab-delimited format.
Tab-delimited format will open in most table browsing software, i.e. Excel, etc.
View this station on the map.
Return to start.