Results
| Country: | Brasil
| | Station: | | | River: | 1 Rio das Mortes | | Area: | 24950 km2 | | Lat: | -14.67 | | Lon: | -52.35 | | Source: | ANEEL | | PointID: | 121 | | Area Units: | km2 | | Discharge Units: | m3/sec | | Starting Year: | 1968 | | Ending Year: | 1997 | | Total Years: | 30 | | Total Usable Years: | 25 | |
| |
| Year | Jan | Feb | Mar | Apr | May | Jun | Jul | Aug | Sep | Oct | Nov | Dec | Avg Annual |
|---|
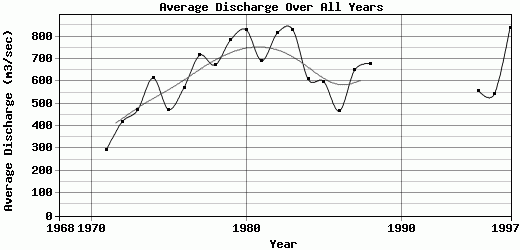
| 1968 | 1356 | 734 | 624 | 449 | 292 | 567 | -9999 | 156 | 144 | 232 | 231 | 404 | -9999 |
| 1969 | 418 | 326 | 252 | 156 | 217 | -9999 | -9999 | -9999 | -9999 | -9999 | 259 | 234 | -9999 |
| 1970 | 380 | 639 | 480 | 191 | -9999 | -9999 | -9999 | -9999 | -9999 | -9999 | -9999 | 296 | -9999 |
| 1971 | 303 | 374 | 567 | 314 | 239 | 156 | 128 | 123 | 125 | 261 | 334 | 611 | 294.58 |
| 1972 | 496 | 974 | 528 | 366 | 184 | 144 | 139 | 142 | 114 | 268 | 722 | 942 | 418.25 |
| 1973 | 832 | 804 | 645 | 546 | 309 | 198 | 166 | 146 | 142 | 327 | 658 | 876 | 470.75 |
| 1974 | 1100 | 781 | 1772 | 987 | 527 | 300 | 246 | 223 | 199 | 295 | 280 | 661 | 614.25 |
| 1975 | 765 | 632 | 603 | 896 | 388 | 230 | 198 | 166 | 145 | 199 | 661 | 802 | 473.75 |
| 1976 | 608 | 1177 | 898 | 503 | 304 | 300 | 202 | 179 | 280 | 427 | 729 | 1261 | 572.33 |
| 1977 | 1526 | 1723 | 918 | 914 | 588 | 426 | 306 | 257 | 279 | 325 | 567 | 762 | 715.92 |
| 1978 | 1611 | 917 | 1086 | 693 | 494 | 404 | 335 | 225 | 273 | 296 | 503 | 1233 | 672.5 |
| 1979 | 2101 | 1934 | 1362 | 775 | 496 | 350 | 290 | 259 | 460 | 326 | 414 | 657 | 785.33 |
| 1980 | 1240 | 2455 | 1346 | 1020 | 589 | 422 | 330 | 261 | 262 | 269 | 487 | 1276 | 829.75 |
| 1981 | 1461 | 954 | 1225 | 760 | 430 | 364 | 278 | 245 | 216 | 338 | 982 | 1054 | 692.25 |
| 1982 | 1745 | 1393 | 1790 | 1316 | 615 | 423 | 316 | 288 | 352 | 378 | 505 | 651 | 814.33 |
| 1983 | 1473 | 1730 | 1178 | 1005 | 548 | 437 | 315 | 258 | 262 | 399 | 742 | 1627 | 831.17 |
| 1984 | 1044 | 938 | 1030 | 872 | 470 | 293 | 253 | 275 | 263 | 329 | 510 | 1026 | 608.58 |
| 1985 | 1602 | 1094 | 1308 | 813 | 422 | 292 | 261 | 211 | 195 | 238 | 304 | 447 | 598.92 |
| 1986 | 814 | 890 | 725 | 427 | 309 | 253 | 209 | 240 | 224 | 234 | 280 | 998 | 466.92 |
| 1987 | 1290 | 971 | 1029 | 689 | 405 | 324 | 267 | 244 | 241 | 301 | 597 | 1458 | 651.33 |
| 1988 | 1275 | 1534 | 1862 | 879 | 432 | 311 | 248 | 211 | 191 | 259 | 319 | 619 | 678.33 |
| 1989 | 1292 | 1707 | 1387 | -9999 | -9999 | -9999 | -9999 | -9999 | -9999 | -9999 | -9999 | -9999 | -9999 |
| 1990 | -9999 | -9999 | -9999 | -9999 | -9999 | -9999 | -9999 | -9999 | -9999 | -9999 | -9999 | -9999 | -9999 |
| 1991 | -9999 | -9999 | -9999 | -9999 | -9999 | -9999 | -9999 | -9999 | -9999 | -9999 | 351 | 589 | -9999 |
| 1992 | 1201 | 1651 | 1181 | 1051 | 608 | 350 | 282 | -9999 | -9999 | -9999 | -9999 | -9999 | -9999 |
| 1993 | -9999 | -9999 | -9999 | -9999 | -9999 | -9999 | -9999 | -9999 | -9999 | -9999 | -9999 | -9999 | -9999 |
| 1994 | -9999 | -9999 | 822 | 674 | 390 | 291 | 260 | 203 | 178 | 228 | 457 | 645 | -9999 |
| 1995 | 757 | 1211 | 658 | 747 | 619 | 377 | 291 | 241 | 244 | 397 | 488 | 651 | 556.75 |
| 1996 | 947 | 741 | 980 | 629 | 407 | 293 | 258 | 235 | 247 | 255 | 761 | 763 | 543 |
| 1997 | 1904 | 1340 | 1188 | 895 | 597 | 936 | 466 | 329 | 304 | 422 | 491 | 1193 | 838.75 |
| |
|
|
|
|
|
|
|
|
|
|
|
|
|
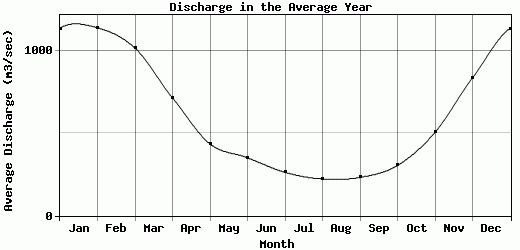
| Avg | 1136.19 | 1139.38 | 1016.44 | 714.12 | 435.16 | 351.71 | 262.78 | 222.48 | 232.17 | 304.48 | 505.28 | 836 | 625.13 |
| |
|
|
|
|
|
|
|
|
|
|
|
|
|
| Std Dev | 473.49 |
498.69 |
409.05 |
277.69 |
130.17 |
153.52 |
70.67 |
50.14 |
77.22 |
64.48 |
187.91 |
346.68 |
146.23 |
| |
|
|
|
|
|
|
|
|
|
|
|
|
|
| | Jan | Feb | Mar | Apr | May | Jun | Jul | Aug | Sep | Oct | Nov | Dec | Avg Annual |
Click here for this table in tab-delimited format.
Tab-delimited format will open in most table browsing software, i.e. Excel, etc.
View this station on the map.
Return to start.