Results
| Country: | China
| | Station: | Hankou | | River: | Changjiang | | Area: | 1488036 km2 | | Lat: | 30.58 | | Lon: | 114.28 | | Source: | RivDIS | | PointID: | 902 | | Area Units: | km2 | | Discharge Units: | m3/sec | | Starting Year: | 1976 | | Ending Year: | 1979 | | Total Years: | 4 | | Total Usable Years: | 4 | |
| |
| Year | Jan | Feb | Mar | Apr | May | Jun | Jul | Aug | Sep | Oct | Nov | Dec | Avg Annual |
|---|
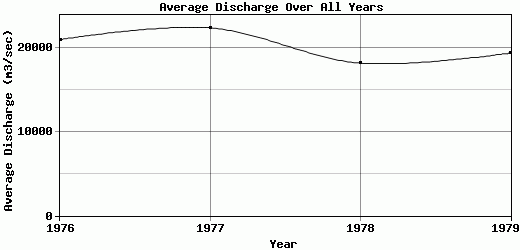
| 1976 | 7870 | 7430 | 10300 | 16500 | 26800 | 32700 | 45300 | 25700 | 26100 | 24500 | 19500 | 9750 | 21037.5 |
| 1977 | 7170 | 7550 | 8680 | 23800 | 34500 | 37700 | 41000 | 33500 | 25500 | 21400 | 19100 | 9340 | 22436.7 |
| 1978 | 8060 | 6580 | 6480 | 10200 | 20300 | 36600 | 33800 | 29000 | 24000 | 18900 | 15200 | 9540 | 18221.7 |
| 1979 | 6020 | 6180 | 6720 | 8270 | 18300 | 25700 | 36200 | 34400 | 42800 | 28000 | 12600 | 7730 | 19410 |
| |
|
|
|
|
|
|
|
|
|
|
|
|
|
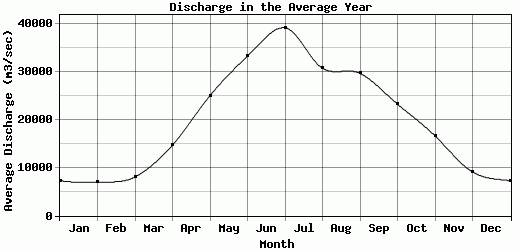
| Avg | 7280 | 6935 | 8045 | 14692.5 | 24975 | 33175 | 39075 | 30650 | 29600 | 23200 | 16600 | 9090 | 20276.5 |
| |
|
|
|
|
|
|
|
|
|
|
|
|
|
| Std Dev | 799.41 |
574.3 |
1556.69 |
6075.46 |
6333.79 |
4698.6 |
4431.35 |
3514.61 |
7659.31 |
3408.08 |
2855.7 |
798.47 |
1598.33 |
| |
|
|
|
|
|
|
|
|
|
|
|
|
|
| | Jan | Feb | Mar | Apr | May | Jun | Jul | Aug | Sep | Oct | Nov | Dec | Avg Annual |
Click here for this table in tab-delimited format.
Tab-delimited format will open in most table browsing software, i.e. Excel, etc.
View this station on the map.
Return to start.