Results
| Country: | U.S.A.
| | Station: | EAGLE BUTTE SD | | River: | CHEYENNE R | | Area: | 63451.24 | | Lat: | 44.69 | | Lon: | -101.22 | | Source: | USGS | | PointID: | 6439500 | | Area Units: | km2 | | Discharge Units: | m3/sec | | Starting Year: | 1949 | | Ending Year: | 1973 | | Total Years: | 25 | | Total Usable Years: | 24 | |
| |
| Year | Jan | Feb | Mar | Apr | May | Jun | Jul | Aug | Sep | Oct | Nov | Dec | Avg Annual |
|---|
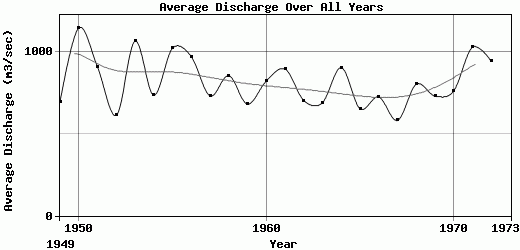
| 1949 | 589.72 | 2264.15 | 1167.21 | 830.44 | 1074.13 | 376.35 | 188.08 | 124.96 | 141.68 | 225.62 | 419.09 | 936.11 | 694.8 |
| 1950 | 1913.68 | 2009.6 | 1859.97 | 1102.48 | 854.08 | 745.68 | 298.24 | 152.27 | 142.91 | 646.08 | 2293.02 | 1762.6 | 1148.38 |
| 1951 | 2369.77 | 1814.41 | 1210.51 | 729.07 | 624.25 | 272.03 | 165.52 | 127.34 | 129.5 | 674.04 | 839.6 | 1951.41 | 908.95 |
| 1952 | 1170.04 | 1790.81 | 1045.9 | 918.32 | 636.86 | 411.82 | 329.3 | 158.94 | 148 | 128.8 | 119.4 | 504.04 | 613.52 |
| 1953 | 2861.39 | 2208.63 | 1029.46 | 662.71 | 899.75 | 690.09 | 266.45 | 177.21 | 176.04 | 263.44 | 1078.69 | 2481.57 | 1066.29 |
| 1954 | 1977.35 | 2070.68 | 818.09 | 934.37 | 364.47 | 463.45 | 253.67 | 191.09 | 248.91 | 325.74 | 494.13 | 697.97 | 736.66 |
| 1955 | 1151.04 | 725.12 | 925.33 | 1541.86 | 844.58 | 720.76 | 312.04 | 193.56 | 224.46 | 596.12 | 1575.37 | 3477.05 | 1023.94 |
| 1956 | 3231.52 | 1151.43 | 1590.96 | 1097.76 | 842.02 | 595.32 | 276.32 | 186.89 | 234.84 | 377.33 | 739.07 | 1346.43 | 972.49 |
| 1957 | 650.01 | 1056.43 | 2212.84 | 940.22 | 547.89 | 329.52 | 188.72 | 177.21 | 214.74 | 303.72 | 454.96 | 1717.29 | 732.8 |
| 1958 | 1836.13 | 2436.37 | 868.42 | 1012.43 | 473.26 | 470.06 | 258.05 | 195.94 | 234.56 | 293.22 | 1211.21 | 972.19 | 855.15 |
| 1959 | 1985.57 | 1433.95 | 771.78 | 732.75 | 675.04 | 365.29 | 209.64 | 184.06 | 281.75 | 558.12 | 507.72 | 486.42 | 682.67 |
| 1960 | 646.08 | 1475.9 | 1404.71 | 1361.95 | 1147.39 | 484.09 | 204.34 | 184.06 | 202.94 | 283.17 | 1409.71 | 1068.56 | 822.74 |
| 1961 | 868.51 | 2852.74 | 2041.93 | 662.15 | 687.56 | 323.47 | 195.48 | 171.45 | 195.01 | 311.94 | 759.65 | 1682.3 | 896.02 |
| 1962 | 914.73 | 729.26 | 1151.22 | 965.42 | 839.37 | 381.95 | 189.87 | 185.89 | 199.16 | 539.85 | 1061.42 | 1293.45 | 704.3 |
| 1963 | 405.02 | 1289.54 | 717.42 | 1479.47 | 1173.24 | 300.84 | 229.28 | 177.67 | 202.47 | 322.81 | 1209.32 | 778.72 | 690.48 |
| 1964 | 2249.01 | 949.3 | 904.04 | 593.24 | 566.89 | 572.85 | 250.69 | 199.77 | 220.31 | 262.62 | 600.6 | 3486.65 | 904.66 |
| 1965 | 2860.56 | 1460.96 | 449.88 | 443.73 | 371.32 | 223.25 | 156.93 | 160.95 | 181.51 | 321.08 | 562.56 | 640.97 | 652.81 |
| 1966 | 2199.5 | 645.63 | 1343.78 | 674.32 | 400.27 | 203.88 | 156.93 | 151.45 | 214.27 | 324.18 | 930.97 | 1465.63 | 725.9 |
| 1967 | 1534.42 | 1129.04 | 692.12 | 492.81 | 406.39 | 269.11 | 179.68 | 161.32 | 209.36 | 388.42 | 606.17 | 926.33 | 582.93 |
| 1968 | 1108.11 | 1582.24 | 687.28 | 398.23 | 464.06 | 278.92 | 172 | 248.33 | 276 | 708.29 | 1533.27 | 2196.03 | 804.4 |
| 1969 | 1977.26 | 1221.17 | 701.26 | 597.49 | 642.07 | 507.12 | 330.3 | 248.46 | 307.24 | 403.59 | 529.72 | 1315.1 | 731.73 |
| 1970 | 2318.16 | 1655.74 | 522.4 | 385.87 | 549.62 | 256.55 | 201.19 | 210.19 | 254.43 | 341.66 | 880.56 | 1573.06 | 762.45 |
| 1971 | 2581.05 | 1280.64 | 1557.16 | 1105.78 | 718.8 | 553.5 | 271.37 | 253.1 | 340.89 | 440.83 | 946.83 | 2301.44 | 1029.28 |
| 1972 | 2245.99 | 1590.63 | 2364.65 | 1081.52 | 776.16 | 456.93 | 215.3 | 243.35 | 346.88 | 315.02 | 481.2 | 1204.48 | 943.51 |
| 1973 | -9999 | -9999 | -9999 | -9999 | -9999 | -9999 | -9999 | -9999 | -9999 | -9999 | -9999 | -9999 | -9999 |
| |
|
|
|
|
|
|
|
|
|
|
|
|
|
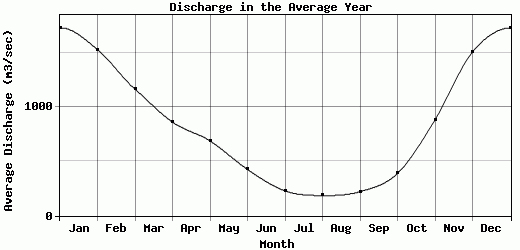
| Avg | 1735.19 | 1534.35 | 1168.26 | 864.35 | 690.81 | 427.2 | 229.14 | 186.06 | 221.99 | 389.82 | 885.18 | 1511.08 | 820.29 |
| |
|
|
|
|
|
|
|
|
|
|
|
|
|
| Std Dev | 794.72 |
556.5 |
521.55 |
316.73 |
230.35 |
154.44 |
52.98 |
34.43 |
57.14 |
148.77 |
470.6 |
804.23 |
150.1 |
| |
|
|
|
|
|
|
|
|
|
|
|
|
|
| | Jan | Feb | Mar | Apr | May | Jun | Jul | Aug | Sep | Oct | Nov | Dec | Avg Annual |
Click here for this table in tab-delimited format.
Tab-delimited format will open in most table browsing software, i.e. Excel, etc.
View this station on the map.
Return to start.