Results
| Country: | U.S.A.
| | Station: | EAU CLAIRE, WI | | River: | CHIPPEWA RIVER | | Area: | 18258430.70 | | Lat: | 44.81 | | Lon: | -91.53 | | Source: | USGS | | PointID: | 5367000 | | Area Units: | km2 | | Discharge Units: | m3/sec | | Starting Year: | 1959 | | Ending Year: | 1967 | | Total Years: | 9 | | Total Usable Years: | 8 | |
| |
| Year | Jan | Feb | Mar | Apr | May | Jun | Jul | Aug | Sep | Oct | Nov | Dec | Avg Annual |
|---|
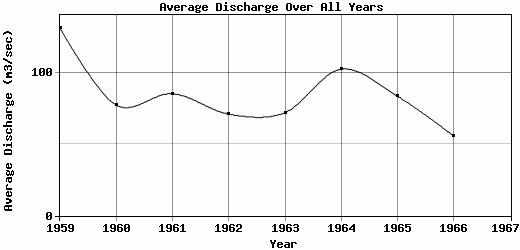
| 1959 | 53.36 | 42.46 | 53.9 | 85.1 | 314.88 | 477.33 | 183 | 48.92 | 54.24 | 83.67 | 93.58 | 91.22 | 131.81 |
| 1960 | 54.99 | 50.13 | 39.3 | 101.88 | 194.75 | 250.36 | 77.13 | 30.4 | 30.22 | 34.21 | 36.5 | 31.22 | 77.59 |
| 1961 | 33.58 | 36.75 | 35.13 | 56.35 | 239.74 | 403.56 | 71.13 | 30.3 | 25.48 | 36.89 | 29.92 | 27.56 | 85.53 |
| 1962 | 36.24 | 57.52 | 35.19 | 81.11 | 153.74 | 234.46 | 77.92 | 32.61 | 23.5 | 32.31 | 42.01 | 48.11 | 71.23 |
| 1963 | 35.04 | 55.58 | 39.65 | 46.18 | 165.02 | 203.89 | 105.08 | 44.21 | 35.89 | 38.38 | 46.02 | 52.22 | 72.26 |
| 1964 | 46.17 | 38.76 | 36.89 | 52.78 | 146.11 | 479.97 | 190.65 | 56.07 | 52.5 | 58.63 | 42.5 | 31.19 | 102.69 |
| 1965 | 32.52 | 39.74 | 48.49 | 70.24 | 224.99 | 329.37 | 83.87 | 34.51 | 34.43 | 36.06 | 42.13 | 28.97 | 83.78 |
| 1966 | 32.84 | 29.84 | 25.13 | 64.83 | 159.93 | 150.5 | 71 | 23.26 | 20.12 | 26.6 | 30.29 | 37.52 | 55.99 |
| 1967 | -9999 | -9999 | -9999 | -9999 | -9999 | -9999 | -9999 | -9999 | -9999 | -9999 | -9999 | -9999 | -9999 |
| |
|
|
|
|
|
|
|
|
|
|
|
|
|
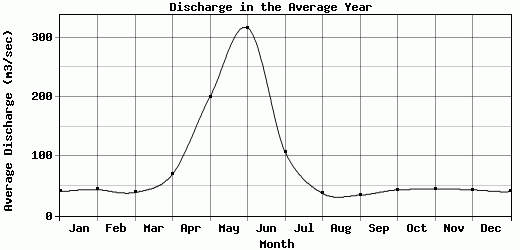
| Avg | 40.59 | 43.85 | 39.21 | 69.81 | 199.9 | 316.18 | 107.47 | 37.53 | 34.55 | 43.34 | 45.37 | 43.5 | 85.11 |
| |
|
|
|
|
|
|
|
|
|
|
|
|
|
| Std Dev | 8.84 |
9.05 |
8.2 |
17.48 |
53.97 |
118.15 |
46.95 |
10.36 |
11.95 |
17.55 |
19.04 |
19.93 |
21.66 |
| |
|
|
|
|
|
|
|
|
|
|
|
|
|
| | Jan | Feb | Mar | Apr | May | Jun | Jul | Aug | Sep | Oct | Nov | Dec | Avg Annual |
Click here for this table in tab-delimited format.
Tab-delimited format will open in most table browsing software, i.e. Excel, etc.
View this station on the map.
Return to start.