Results
| Country: | U.S.A.
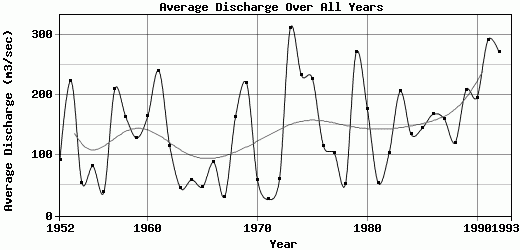
| | Station: | THREE RIVERS, TX | | River: | CHOKE CANYON RESERVOIR OWC | | Area: | 14218.26 | | Lat: | 28.48 | | Lon: | -98.24 | | Source: | USGS | | PointID: | 8206910 | | Area Units: | km2 | | Discharge Units: | m3/sec | | Starting Year: | 1952 | | Ending Year: | 1993 | | Total Years: | 42 | | Total Usable Years: | 41 | |
| |
| Year | Jan | Feb | Mar | Apr | May | Jun | Jul | Aug | Sep | Oct | Nov | Dec | Avg Annual |
|---|
| 1952 | 38.43 | 126.55 | 172.59 | 263.6 | 295.99 | 93.14 | 27.91 | 25.73 | 6.97 | 3.48 | 8.45 | 50.3 | 92.76 |
| 1953 | 109.62 | 194.33 | 394.37 | 190.6 | 1363.05 | 205.83 | 70.76 | 54.77 | 30.72 | 10.92 | 9.86 | 47.71 | 223.55 |
| 1954 | 102.34 | 68.48 | 41.91 | 83.17 | 204.09 | 69.2 | 27.44 | 11.06 | 5.25 | 2.5 | 7.46 | 30.43 | 54.44 |
| 1955 | 69.54 | 215.78 | 105.71 | 307.46 | 96.69 | 79.47 | 21.48 | 35.05 | 14.9 | 12.55 | 12.42 | 8.44 | 81.62 |
| 1956 | 8.52 | 113.04 | 50.67 | 92.43 | 128.24 | 24.23 | 24.7 | 14.68 | 3.51 | 3.48 | 0.91 | 0.53 | 38.75 |
| 1957 | 3.39 | 12.03 | 95.37 | 185.53 | 875.21 | 234.44 | 41.45 | 24.13 | 13.83 | 134.92 | 523.63 | 375.61 | 209.96 |
| 1958 | 410.64 | 276.46 | 177.4 | 117.83 | 393.72 | 49.11 | 46.89 | 33.27 | 158.77 | 196.35 | 57.04 | 42.83 | 163.36 |
| 1959 | 44.16 | 206.2 | 138.67 | 324.04 | 269.83 | 148.69 | 93.1 | 58.92 | 28.67 | 17.53 | 66.58 | 150.78 | 128.93 |
| 1960 | 263.99 | 318.83 | 344.86 | 102.81 | 94.4 | 46.62 | 58.82 | 19.68 | 14.02 | 82.62 | 116.62 | 514.41 | 164.81 |
| 1961 | 727.47 | 472.08 | 500.66 | 362.93 | 89.66 | 62.89 | 135.34 | 38.08 | 109.7 | 32.29 | 47.95 | 309.55 | 240.72 |
| 1962 | 225.48 | 233.36 | 171.51 | 119.65 | 334.35 | 92.41 | 41.92 | 26.59 | 10.82 | 16.71 | 33.75 | 82.92 | 115.79 |
| 1963 | 103.17 | 107.31 | 96.1 | 84.04 | 33.82 | 27.44 | 23.37 | 21.25 | 9.26 | 14.19 | 7.41 | 19.23 | 45.55 |
| 1964 | 45.03 | 55.46 | 176.66 | 202.98 | 148.16 | 38.74 | 21.41 | 8.58 | 5.73 | 5.28 | 2.66 | 3.7 | 59.53 |
| 1965 | 16.99 | 50.5 | 93.38 | 99 | 64.05 | 105.57 | 35.53 | 15.71 | 18.11 | 6.65 | 3.65 | 62.04 | 47.6 |
| 1966 | 72.69 | 223.28 | 55.75 | 59.16 | 349.35 | 67.78 | 53.42 | 25.33 | 37.99 | 50.14 | 31.95 | 35.16 | 88.5 |
| 1967 | 34.17 | 19.08 | 33.67 | 59.71 | 59.35 | 56.44 | 25.39 | 26.46 | 21.11 | 13.49 | 11.95 | 15.06 | 31.32 |
| 1968 | 85.05 | 69.49 | 91.77 | 317.91 | 343.53 | 299.96 | 209.67 | 98.65 | 42 | 74.88 | 105.77 | 232.35 | 164.25 |
| 1969 | 194.28 | 240.94 | 401.29 | 572.66 | 638.87 | 331.05 | 51.69 | 63.35 | 45.88 | 33.23 | 24.69 | 39.8 | 219.81 |
| 1970 | 73.97 | 60.56 | 129.25 | 126.6 | 104.98 | 41.19 | 33.35 | 21.89 | 28.24 | 21.96 | 32.14 | 28.92 | 58.59 |
| 1971 | 26.96 | 28.74 | 33.34 | 39.93 | 28.41 | 36.26 | 31.89 | 9.58 | 8.85 | 10.55 | 7.16 | 63.33 | 27.08 |
| 1972 | 77.45 | 58.37 | 62.08 | 66.11 | 83.87 | 68.35 | 51.12 | 47.79 | 42.67 | 34.2 | 50.1 | 79.87 | 60.17 |
| 1973 | 199.47 | 260.8 | 320.12 | 533.87 | 459.52 | 426.92 | 328.77 | 105.6 | 188.37 | 202.98 | 299.21 | 412.91 | 311.54 |
| 1974 | 549.44 | 589.09 | 438.99 | 161.74 | 129.39 | 118.95 | 102.45 | 87.49 | 113.42 | 56.36 | 184.6 | 261.82 | 232.81 |
| 1975 | 369.32 | 468.9 | 350.83 | 216.83 | 429.1 | 233.46 | 203.68 | 181.99 | 105.9 | 80.35 | 45.01 | 39.21 | 227.05 |
| 1976 | 39.84 | 42.59 | 72.29 | 90.32 | 223.06 | 183.4 | 183.17 | 185.92 | 150.98 | 66.33 | 56.55 | 98.58 | 116.09 |
| 1977 | 153.38 | 126.78 | 149.48 | 191.09 | 201.23 | 109 | 81.47 | 71.24 | 59.44 | 45.19 | 16.67 | 33.96 | 103.24 |
| 1978 | 87.65 | 111.48 | 42.88 | 52.68 | 50.35 | 70.12 | 75.93 | 44.42 | 11.4 | 13.72 | 18.96 | 41.26 | 51.74 |
| 1979 | 161.36 | 283.22 | 419.09 | 497.91 | 496.55 | 481.48 | 196.79 | 233.66 | 172.16 | 73.79 | 62.6 | 175.12 | 271.14 |
| 1980 | 175.44 | 306.11 | 217.95 | 360.29 | 358.53 | 265.76 | 108.55 | 85.91 | 64.84 | 59.71 | 64.91 | 63.49 | 177.62 |
| 1981 | 52.61 | 7.14 | 41.4 | 34.87 | 32.54 | 138.98 | 80.3 | 56.02 | 53.17 | 54.29 | 50.29 | 48.18 | 54.15 |
| 1982 | 48.71 | 52.99 | 50.36 | 175.84 | 245.2 | 95.96 | 84.4 | 75.13 | 82.97 | 73.83 | 72.75 | 196.42 | 104.55 |
| 1983 | 265.26 | 358.94 | 425.3 | 220.93 | 224.08 | 401.63 | 137.8 | 93.41 | 63.41 | 63.74 | 73.38 | 145.02 | 206.07 |
| 1984 | 88.24 | 270.09 | 405.85 | 135.07 | 101.68 | 96.62 | 92.6 | 83.33 | 77.45 | 113.41 | 96.47 | 56.48 | 134.77 |
| 1985 | 104.59 | 183.05 | 282.23 | 245.98 | 153.27 | 90.57 | 91.36 | 86.24 | 79.79 | 97.82 | 106.18 | 215.46 | 144.71 |
| 1986 | 95.37 | 224.18 | 79.6 | 83.93 | 210.82 | 361.24 | 251.11 | 86.98 | 82.4 | 85.38 | 193.24 | 266.15 | 168.37 |
| 1987 | 346.55 | 232.19 | 456.36 | 169.82 | 80.5 | 89.43 | 68.2 | 73.38 | 86.2 | 79.31 | 110.39 | 136.65 | 160.75 |
| 1988 | 213.78 | 122.3 | 246.51 | 177.84 | 83.49 | 95.18 | 93.96 | 89.78 | 88.75 | 80.71 | 80.55 | 81.63 | 121.21 |
| 1989 | 105.69 | 145.69 | 126.7 | 233.73 | 280.74 | 471.48 | 647.55 | 196.23 | 65.21 | 64.28 | 71.66 | 90.63 | 208.3 |
| 1990 | 151.99 | 266.13 | 246.69 | 346.85 | 359.95 | 474.32 | 105.41 | 103.49 | 86.94 | 71.19 | 67.28 | 71.8 | 196 |
| 1991 | 377.13 | 482.7 | 474.17 | 366.63 | 500.75 | 470.35 | 204.57 | 136.52 | 119.61 | 78.04 | 81.28 | 208.19 | 291.66 |
| 1992 | 481.94 | 500.43 | 748.3 | 544.82 | 199.6 | 161.12 | 94.47 | 95.08 | 89.09 | 93.21 | 95.48 | 150.72 | 271.19 |
| 1993 | -9999 | -9999 | -9999 | -9999 | -9999 | -9999 | -9999 | -9999 | -9999 | -9999 | -9999 | -9999 | -9999 |
| |
|
|
|
|
|
|
|
|
|
|
|
|
|
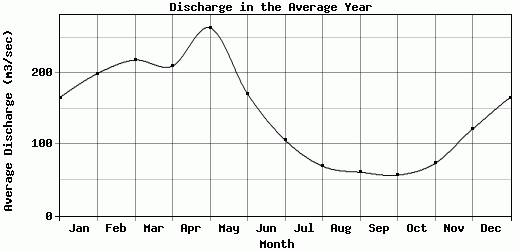
| Avg | 165.88 | 199.65 | 218.59 | 210.22 | 263.9 | 171.09 | 106.32 | 69.57 | 60.94 | 56.87 | 73.41 | 121.63 | 143.17 |
| |
|
|
|
|
|
|
|
|
|
|
|
|
|
| Std Dev | 159.51 |
147.47 |
169.83 |
143.7 |
249.87 |
142.99 |
110.56 |
53.77 |
49.03 |
46.8 |
92.1 |
118.91 |
78.77 |
| |
|
|
|
|
|
|
|
|
|
|
|
|
|
| | Jan | Feb | Mar | Apr | May | Jun | Jul | Aug | Sep | Oct | Nov | Dec | Avg Annual |
Click here for this table in tab-delimited format.
Tab-delimited format will open in most table browsing software, i.e. Excel, etc.
View this station on the map.
Return to start.