Results
| Country: | U.S.S.R.
| | Station: | Brook Shumny River | | River: | Amguema | | Area: | 26700 km2 | | Lat: | 67.66 | | Lon: | -178.5 | | Source: | | | PointID: | 124 | | Area Units: | km2 | | Discharge Units: | m3/sec | | Starting Year: | 1944 | | Ending Year: | 1984 | | Total Years: | 41 | | Total Usable Years: | 26 | |
| |
| Year | Jan | Feb | Mar | Apr | May | Jun | Jul | Aug | Sep | Oct | Nov | Dec | Avg Annual |
|---|
| 1944 | 0.3 | -9999 | -9999 | -9999 | 15 | 1230 | 1110 | 482 | 431 | 71 | 23 | 3.4 | -9999 |
| 1945 | 0.9 | 0 | -9999 | -9999 | 9.8 | 1350 | 659 | 387 | 171 | 103 | 18.5 | 4.2 | -9999 |
| 1946 | 0.9 | -9999 | -9999 | -9999 | 46.5 | 1040 | 819 | 416 | 216 | 32 | 13.5 | 6 | -9999 |
| 1947 | 0.4 | 0 | -9999 | 0 | 1.1 | 2190 | 1170 | 820 | 212 | 67.5 | 12 | 1 | -9999 |
| 1948 | -9999 | -9999 | -9999 | -9999 | 119 | 1320 | 461 | 398 | 152 | 31.5 | 10.5 | 2.6 | -9999 |
| 1949 | -9999 | -9999 | -9999 | -9999 | -9999 | 991 | 1330 | 626 | 453 | 46.5 | 14.5 | 2 | -9999 |
| 1950 | 0.3 | -9999 | -9999 | -9999 | -9999 | 1170 | 1630 | 1290 | 299 | 48 | 15.5 | 6 | -9999 |
| 1951 | -9999 | -9999 | -9999 | -9999 | 6.5 | 1380 | 1000 | 792 | 172 | 41.5 | 18.5 | 2.2 | -9999 |
| 1952 | -9999 | -9999 | -9999 | -9999 | -9999 | 722 | 1410 | 476 | 140 | 50 | 19 | 4.2 | -9999 |
| 1953 | 0.1 | -9999 | -9999 | -9999 | -9999 | 1290 | 380 | 333 | 325 | 86.5 | 35 | 5.8 | -9999 |
| 1954 | 0.3 | -9999 | -9999 | -9999 | 2.3 | 1420 | 688 | 524 | 505 | 94.5 | 32 | 6.9 | -9999 |
| 1955 | 0.3 | -9999 | -9999 | -9999 | 0 | 913 | 588 | 551 | 211 | 33.5 | 4.4 | 0.8 | -9999 |
| 1956 | 0.1 | -9999 | -9999 | -9999 | 0.1 | 1380 | 854 | 563 | 349 | 137 | 49 | 0.4 | -9999 |
| 1957 | -9999 | -9999 | -9999 | -9999 | -9999 | 2240 | 864 | 911 | 216 | 37 | 14.5 | 3.8 | -9999 |
| 1958 | 0.1 | -9999 | -9999 | -9999 | 0.2 | 1380 | 861 | 583 | 302 | 92 | 19.5 | 3.2 | -9999 |
| 1959 | -9999 | -9999 | -9999 | -9999 | 29.5 | 1510 | 513 | 685 | 360 | 123 | 15 | 2.3 | -9999 |
| 1960 | -9999 | -9999 | -9999 | -9999 | 0.1 | 1530 | 664 | 742 | 280 | 43.5 | 16 | 3.7 | -9999 |
| 1961 | 1.6 | 0.1 | -9999 | -9999 | 71 | 1700 | 759 | 646 | 294 | 49 | 14 | 1.8 | -9999 |
| 1962 | -9999 | -9999 | -9999 | -9999 | 1.2 | 2460 | 1550 | 775 | 231 | 58 | 15 | 3 | -9999 |
| 1963 | -9999 | -9999 | -9999 | -9999 | 0.5 | 1600 | 1060 | 469 | 270 | 57 | 16 | 3.5 | -9999 |
| 1964 | 0.3 | -9999 | -9999 | -9999 | 20.5 | 1760 | 493 | 326 | 465 | 93.5 | 33 | 6.6 | -9999 |
| 1965 | -9999 | -9999 | -9999 | -9999 | -9999 | -9999 | -9999 | -9999 | -9999 | -9999 | -9999 | -9999 | -9999 |
| 1966 | -9999 | -9999 | -9999 | -9999 | -9999 | -9999 | -9999 | -9999 | -9999 | -9999 | -9999 | -9999 | -9999 |
| 1967 | -9999 | -9999 | -9999 | -9999 | -9999 | -9999 | -9999 | -9999 | -9999 | -9999 | -9999 | -9999 | -9999 |
| 1968 | -9999 | -9999 | -9999 | -9999 | -9999 | -9999 | -9999 | -9999 | -9999 | -9999 | -9999 | -9999 | -9999 |
| 1969 | 0 | 0 | -9999 | -9999 | 36.5 | 1540 | 795 | 234 | 277 | 47 | 15 | 3.6 | -9999 |
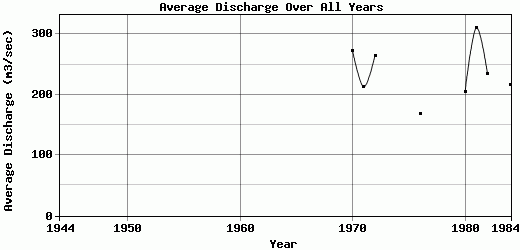
| 1970 | 0.4 | 0 | 0 | 0 | 80.5 | 1230 | 580 | 990 | 299 | 72 | 20.5 | 4.8 | 273.1 |
| 1971 | 2.1 | 0.1 | 0 | 0 | 0 | 1420 | 630 | 334 | 117 | 33 | 14.5 | 2.3 | 212.75 |
| 1972 | 0 | 0 | 0 | 0 | 15.5 | 1090 | 1100 | 479 | 431 | 37.5 | 22 | 3.8 | 264.9 |
| 1973 | -9999 | -9999 | -9999 | -9999 | -9999 | 1820 | 938 | 336 | 239 | 50 | 20 | 4 | -9999 |
| 1974 | -9999 | -9999 | -9999 | -9999 | 104 | 1740 | 684 | 482 | 489 | 78 | 24 | 7.2 | -9999 |
| 1975 | 0.6 | -9999 | -9999 | -9999 | 0 | 1020 | 644 | 303 | 244 | 60.5 | 14.5 | 2.7 | -9999 |
| 1976 | 0 | 0 | 0 | 0 | 0.2 | 870 | 350 | 451 | 279 | 53 | 13.5 | 5.2 | 168.49 |
| 1977 | -9999 | -9999 | -9999 | -9999 | -9999 | -9999 | -9999 | -9999 | -9999 | -9999 | -9999 | -9999 | -9999 |
| 1978 | -9999 | -9999 | -9999 | -9999 | -9999 | -9999 | -9999 | -9999 | -9999 | -9999 | -9999 | -9999 | -9999 |
| 1979 | -9999 | -9999 | -9999 | -9999 | -9999 | -9999 | 894 | 817 | 436 | 75 | 15 | 0.3 | -9999 |
| 1980 | 0 | 0 | 0 | 0 | 4.7 | 1520 | 713 | 31 | 124 | 49.5 | 8.4 | 0.08 | 204.22 |
| 1981 | 0 | 0 | 0 | 0 | 31.5 | 1920 | 1080 | 363 | 245 | 70.5 | 18.5 | 0.77 | 310.77 |
| 1982 | 0 | 0 | 0 | 0 | 0 | 1210 | 1130 | 263 | 127 | 68 | 21 | 3.3 | 235.19 |
| 1983 | -9999 | -9999 | -9999 | -9999 | -9999 | -9999 | -9999 | -9999 | -9999 | -9999 | -9999 | -9999 | -9999 |
| 1984 | 0.1 | 0 | 0 | 0 | 0.9 | 1380 | 475 | 420 | 213 | 71.5 | 27 | 6.2 | 216.14 |
| |
|
|
|
|
|
|
|
|
|
|
|
|
|
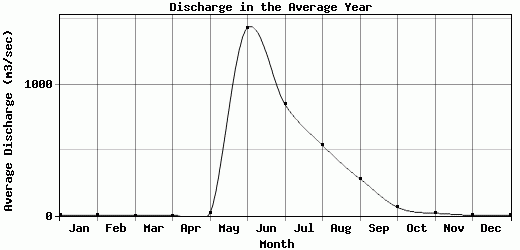
| Avg | 0.4 | 0.02 | 0 | 0 | 22.11 | 1434.42 | 849.29 | 538.18 | 281.59 | 63.56 | 18.89 | 3.46 | 235.7 |
| |
|
|
|
|
|
|
|
|
|
|
|
|
|
| Std Dev | 0.53 |
0.04 |
0 |
0 |
33.17 |
388.65 |
319.69 |
245.55 |
109.21 |
25.55 |
8.31 |
1.96 |
42.29 |
| |
|
|
|
|
|
|
|
|
|
|
|
|
|
| | Jan | Feb | Mar | Apr | May | Jun | Jul | Aug | Sep | Oct | Nov | Dec | Avg Annual |
Click here for this table in tab-delimited format.
Tab-delimited format will open in most table browsing software, i.e. Excel, etc.
View this station on the map.
Return to start.