Results
| Country: | U.S.A.
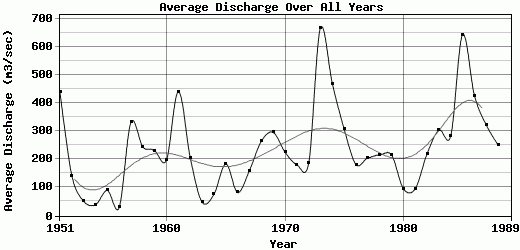
| | Station: | Mannford, OK | | River: | Cimarron River | | Area: | 48816.02 | | Lat: | 36.16 | | Lon: | -96.39 | | Source: | USGS | | PointID: | 7164000 | | Area Units: | km2 | | Discharge Units: | m3/sec | | Starting Year: | 1951 | | Ending Year: | 1989 | | Total Years: | 39 | | Total Usable Years: | 38 | |
| |
| Year | Jan | Feb | Mar | Apr | May | Jun | Jul | Aug | Sep | Oct | Nov | Dec | Avg Annual |
|---|
| 1951 | 76.74 | 219.85 | 344.93 | 178.83 | 295.89 | 346.98 | 2091.35 | 258.51 | 564.07 | 187.11 | 439.19 | 273.88 | 439.78 |
| 1952 | 160.32 | 281.02 | 368.01 | 335.6 | 198.58 | 127.7 | 68.47 | 57.68 | 55.13 | 20.6 | 15.71 | 21.71 | 142.54 |
| 1953 | 20.15 | 21.39 | 74.44 | 199.77 | 162.34 | 35.42 | 30.88 | 30.21 | 20.89 | 9.64 | 8.43 | 7.62 | 51.76 |
| 1954 | 17.32 | 5.98 | 15.78 | 30.09 | 152.89 | 80.27 | 51.24 | 5.23 | 6.18 | 16.38 | 41.49 | 45.07 | 38.99 |
| 1955 | 99.89 | 66.4 | 97.77 | 84.9 | 85.1 | 116.56 | 191.37 | 59.99 | 75.19 | 104.72 | 34.82 | 59.35 | 89.67 |
| 1956 | 23.32 | 13.63 | 22.25 | 15.68 | 81.02 | 68.04 | 52.99 | 41.25 | 4.9 | 3.63 | 8.78 | 14.54 | 29.17 |
| 1957 | 13.8 | 66.39 | 60.02 | 382.1 | 1193 | 1364.22 | 641.12 | 69.66 | 81.64 | 31.28 | 47.47 | 49.74 | 333.37 |
| 1958 | 39.07 | 71.68 | 462.85 | 408.42 | 302.34 | 131.34 | 947.21 | 236.82 | 174.36 | 51.47 | 72.42 | 37.5 | 244.62 |
| 1959 | 26.79 | 111.57 | 195.15 | 62.01 | 212.68 | 70.55 | 348.05 | 153.56 | 105.77 | 967.86 | 341.23 | 180.59 | 231.32 |
| 1960 | 191.97 | 183.54 | 251.36 | 333.92 | 510.64 | 176.43 | 117.02 | 154.67 | 93.36 | 70.1 | 145.07 | 154.57 | 198.55 |
| 1961 | 39.43 | 72.6 | 206.24 | 334.64 | 1834.92 | 345.98 | 441.28 | 268.29 | 585.48 | 357.49 | 476.39 | 340.34 | 441.92 |
| 1962 | 233.74 | 320.89 | 201.31 | 192.83 | 50.88 | 275.08 | 112.87 | 81.98 | 297.37 | 436.02 | 174.01 | 96.47 | 206.12 |
| 1963 | 96.61 | 31.95 | 144.64 | 22.64 | 16.19 | 37.99 | 73.01 | 67.33 | 67.88 | 12.49 | 2.19 | 1.65 | 47.88 |
| 1964 | 1.45 | 3.6 | 4.99 | 25.13 | 16.4 | 421.28 | 113.62 | 75.57 | 94.07 | 17.38 | 100.41 | 37.21 | 75.93 |
| 1965 | 65.05 | 36.06 | 138.61 | 655.93 | 133.26 | 428.29 | 238.61 | 68.73 | 192.96 | 188.35 | 25.96 | 37.95 | 184.15 |
| 1966 | 98.73 | 148.3 | 78.46 | 100.61 | 195.69 | 78.15 | 55.38 | 104.06 | 68.83 | 23.17 | 14.18 | 27.3 | 82.74 |
| 1967 | 25.26 | 23.07 | 13.43 | 81.82 | 29.4 | 309.47 | 484.65 | 158.58 | 96.76 | 224.68 | 312.63 | 163.04 | 160.23 |
| 1968 | 150.98 | 465.85 | 363.52 | 415.96 | 237 | 324.29 | 204.28 | 222.6 | 68.68 | 80.14 | 291.03 | 353.97 | 264.86 |
| 1969 | 372.12 | 446.9 | 303.76 | 488.28 | 392.57 | 397.24 | 413.48 | 158.28 | 151.33 | 215 | 114.75 | 102.93 | 296.39 |
| 1970 | 64.26 | 41.72 | 77.9 | 303.54 | 871.38 | 459.68 | 110.43 | 49.35 | 193.39 | 272.67 | 174.53 | 96.8 | 226.3 |
| 1971 | 266.8 | 191.11 | 221 | 9.82 | 88.69 | 332.01 | 250.7 | 144.96 | 48.26 | 135.03 | 59.13 | 428.26 | 181.31 |
| 1972 | 201.53 | 64.89 | 68.81 | 70.49 | 235.78 | 24.71 | 157.73 | 69.05 | 99.32 | 119.04 | 817.7 | 300.66 | 185.81 |
| 1973 | 689.93 | 545.41 | 929.16 | 1377.81 | 1143.92 | 596.87 | 169.1 | 116.86 | 144.85 | 611.65 | 553.69 | 1144.65 | 668.66 |
| 1974 | 454.08 | 431.33 | 859.92 | 337.94 | 289.92 | 957.45 | 117.9 | 90.04 | 302.83 | 168.06 | 1174.23 | 454.99 | 469.89 |
| 1975 | 311.47 | 507.5 | 835.66 | 572.1 | 208.09 | 512.83 | 223.31 | 119.06 | 156.35 | 94.88 | 42.61 | 109.74 | 307.8 |
| 1976 | 142.63 | 37.18 | 144.17 | 274.95 | 275.6 | 234.79 | 791.46 | 96.23 | 86.71 | 46.21 | 16.66 | 30.32 | 181.41 |
| 1977 | 36.55 | 11.78 | 56.58 | 61.73 | 62.57 | 459.97 | 497.85 | 182.04 | 254.81 | 272.78 | 434.48 | 132.53 | 205.31 |
| 1978 | 68.25 | 131.31 | 499.48 | 812.6 | 455.36 | 266.4 | 115.97 | 71.38 | 78.16 | 25.32 | 36.66 | 32.93 | 216.15 |
| 1979 | 44.11 | 120.97 | 387.67 | 373.73 | 240.02 | 346.99 | 385.17 | 213.02 | 96.66 | 11.31 | 139.19 | 233.43 | 216.02 |
| 1980 | 60.34 | 134.43 | 202.83 | 391.72 | 107.34 | 66.01 | 69.04 | 52.92 | 48.54 | 4.77 | 6.02 | 7.1 | 95.92 |
| 1981 | 3.85 | 8.82 | 29.63 | 17.7 | 38.28 | 130.82 | 208.37 | 135.83 | 66.2 | 89.23 | 310.18 | 111.72 | 95.89 |
| 1982 | 135.86 | 464.1 | 294.38 | 134.49 | 256.24 | 733.52 | 271.19 | 83.7 | 29.22 | 16.62 | 32.65 | 188.49 | 220.04 |
| 1983 | 128.7 | 357.38 | 241.55 | 857.34 | 953.28 | 403.18 | 181.7 | 81.62 | 13.81 | 56.12 | 152.27 | 228.8 | 304.65 |
| 1984 | 78.86 | 115.3 | 691.57 | 1080.67 | 370.73 | 257.05 | 45.8 | 29.61 | 23.14 | 115.1 | 195.71 | 400.68 | 283.69 |
| 1985 | 718.35 | 399.12 | 1257.82 | 673.49 | 542.5 | 756.44 | 229.87 | 234.89 | 316.23 | 421.3 | 1226.6 | 946.88 | 643.62 |
| 1986 | 205.41 | 297.77 | 205.82 | 556.38 | 362.8 | 217.39 | 140.36 | 77.74 | 192.62 | 1986.06 | 554.08 | 324.59 | 426.75 |
| 1987 | 266.93 | 482.74 | 949.99 | 411.54 | 199.76 | 301.31 | 160.48 | 53.25 | 87.59 | 41.73 | 227.8 | 687.58 | 322.56 |
| 1988 | 685.5 | 232.29 | 442.11 | 944.37 | 109.81 | 36.07 | 63.71 | 31.03 | 59.24 | 84.15 | 176.72 | 146.8 | 250.98 |
| 1989 | -9999 | -9999 | -9999 | -9999 | -9999 | -9999 | -9999 | -9999 | -9999 | -9999 | -9999 | -9999 | -9999 |
| |
|
|
|
|
|
|
|
|
|
|
|
|
|
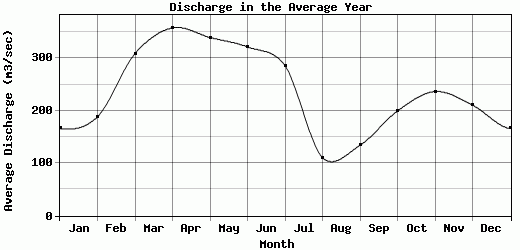
| Avg | 166.21 | 188.57 | 309.04 | 358.2 | 339.81 | 321.81 | 285.97 | 110.67 | 134.28 | 199.72 | 236.77 | 210.85 | 238.49 |
| |
|
|
|
|
|
|
|
|
|
|
|
|
|
| Std Dev | 187.88 |
171.15 |
302.89 |
323.21 |
379.29 |
275.31 |
361.93 |
69.11 |
131.19 |
351.11 |
295.93 |
250.64 |
149.81 |
| |
|
|
|
|
|
|
|
|
|
|
|
|
|
| | Jan | Feb | Mar | Apr | May | Jun | Jul | Aug | Sep | Oct | Nov | Dec | Avg Annual |
Click here for this table in tab-delimited format.
Tab-delimited format will open in most table browsing software, i.e. Excel, etc.
View this station on the map.
Return to start.