Results
| Country: | U.S.A.
| | Station: | Waynoka, OK | | River: | Cimarron River | | Area: | 34533.01 | | Lat: | 36.52 | | Lon: | -98.87 | | Source: | USGS | | PointID: | 7158000 | | Area Units: | km2 | | Discharge Units: | m3/sec | | Starting Year: | 1925 | | Ending Year: | 1949 | | Total Years: | 25 | | Total Usable Years: | 12 | |
| |
| Year | Jan | Feb | Mar | Apr | May | Jun | Jul | Aug | Sep | Oct | Nov | Dec | Avg Annual |
|---|
| 1925 | -9999 | -9999 | -9999 | -9999 | -9999 | -9999 | -9999 | -9999 | -9999 | -9999 | -9999 | -9999 | -9999 |
| 1926 | -9999 | -9999 | -9999 | -9999 | -9999 | -9999 | -9999 | -9999 | -9999 | -9999 | -9999 | -9999 | -9999 |
| 1927 | -9999 | -9999 | -9999 | -9999 | -9999 | -9999 | -9999 | -9999 | -9999 | -9999 | -9999 | -9999 | -9999 |
| 1928 | -9999 | -9999 | -9999 | -9999 | -9999 | -9999 | -9999 | -9999 | -9999 | -9999 | -9999 | -9999 | -9999 |
| 1929 | -9999 | -9999 | -9999 | -9999 | -9999 | -9999 | -9999 | -9999 | -9999 | -9999 | -9999 | -9999 | -9999 |
| 1930 | -9999 | -9999 | -9999 | -9999 | -9999 | -9999 | -9999 | -9999 | -9999 | -9999 | -9999 | -9999 | -9999 |
| 1931 | -9999 | -9999 | -9999 | -9999 | -9999 | -9999 | -9999 | -9999 | -9999 | -9999 | -9999 | -9999 | -9999 |
| 1932 | -9999 | -9999 | -9999 | -9999 | -9999 | -9999 | -9999 | -9999 | -9999 | -9999 | -9999 | -9999 | -9999 |
| 1933 | -9999 | -9999 | -9999 | -9999 | -9999 | -9999 | -9999 | -9999 | -9999 | -9999 | -9999 | -9999 | -9999 |
| 1934 | -9999 | -9999 | -9999 | -9999 | -9999 | -9999 | -9999 | -9999 | -9999 | -9999 | -9999 | -9999 | -9999 |
| 1935 | -9999 | -9999 | -9999 | -9999 | -9999 | -9999 | -9999 | -9999 | -9999 | -9999 | -9999 | -9999 | -9999 |
| 1936 | -9999 | -9999 | -9999 | -9999 | -9999 | -9999 | -9999 | -9999 | -9999 | -9999 | -9999 | -9999 | -9999 |
| 1937 | -9999 | -9999 | -9999 | -9999 | -9999 | -9999 | -9999 | -9999 | -9999 | -9999 | -9999 | -9999 | -9999 |
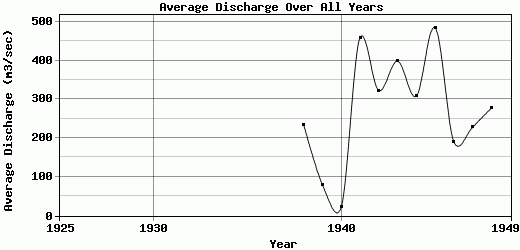
| 1938 | 51.66 | 354.68 | 237.37 | 396.57 | 635.31 | 904.52 | 99.09 | 56.86 | 28.95 | 13.73 | 23.87 | 16.74 | 234.95 |
| 1939 | 16.32 | 44.84 | 57.24 | 78.64 | 401.8 | 212.38 | 66.78 | 38.86 | 9.16 | 6.82 | 9.44 | 10.29 | 79.38 |
| 1940 | 9.29 | 14.14 | 15.58 | 41.72 | 23.33 | 19.09 | 11.5 | 6.95 | 18.69 | 3.66 | 61.7 | 39.08 | 22.06 |
| 1941 | 293.87 | 235.96 | 55.51 | 750.89 | 106.42 | 622.36 | 67.3 | 65.49 | 461.04 | 1608.26 | 1085.35 | 159.37 | 459.32 |
| 1942 | 99.72 | 260.86 | 175.19 | 767.91 | 272.09 | 668.62 | 151.4 | 106.34 | 405.65 | 232.03 | 338.32 | 397.26 | 322.95 |
| 1943 | 242.29 | 160.14 | 158.73 | 243.96 | 2761.46 | 680.55 | 179.06 | 81.14 | 38.38 | 82.64 | 97.15 | 58.88 | 398.7 |
| 1944 | 69.15 | 147.72 | 436.21 | 952.27 | 742.5 | 347.88 | 151.45 | 126.81 | 126.92 | 274.18 | 119.33 | 205.98 | 308.37 |
| 1945 | 146.52 | 158.31 | 818.64 | 1683.18 | 698.83 | 581.21 | 386.48 | 187.69 | 437.46 | 585.38 | 75.54 | 59.09 | 484.86 |
| 1946 | 392.89 | 350.58 | 195.13 | 129.15 | 336.37 | 287.86 | 129.82 | 73.91 | 67.4 | 62.85 | 101.89 | 166.37 | 191.18 |
| 1947 | 78.93 | 71.69 | 95.38 | 1124.43 | 528.43 | 384.78 | 148.31 | 81.28 | 62.81 | 71.22 | 52.41 | 33.59 | 227.77 |
| 1948 | 54.89 | 64.34 | 211.56 | 160.55 | 147.67 | 718.2 | 993.35 | 595.02 | 115.64 | 90.24 | 83.7 | 92.52 | 277.31 |
| 1949 | -9999 | -9999 | -9999 | -9999 | -9999 | -9999 | -9999 | -9999 | -9999 | -9999 | -9999 | -9999 | -9999 |
| |
|
|
|
|
|
|
|
|
|
|
|
|
|
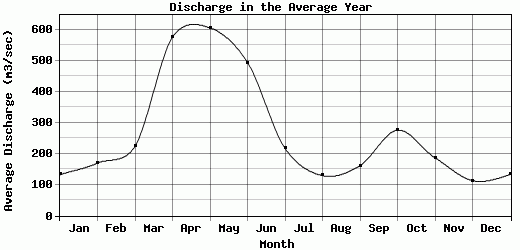
| Avg | 132.32 | 169.39 | 223.32 | 575.39 | 604.93 | 493.4 | 216.78 | 129.12 | 161.1 | 275.55 | 186.25 | 112.65 | 273.35 |
| |
|
|
|
|
|
|
|
|
|
|
|
|
|
| Std Dev | 118.82 |
113.15 |
217.97 |
503.01 |
720.17 |
250.23 |
261.97 |
154.04 |
171.55 |
451.99 |
296.17 |
109.66 |
138.11 |
| |
|
|
|
|
|
|
|
|
|
|
|
|
|
| | Jan | Feb | Mar | Apr | May | Jun | Jul | Aug | Sep | Oct | Nov | Dec | Avg Annual |
Click here for this table in tab-delimited format.
Tab-delimited format will open in most table browsing software, i.e. Excel, etc.
View this station on the map.
Return to start.