Results
| Country: | U.S.S.R.
| | Station: | Chatly | | River: | Amu-Darya | | Area: | 450000 km2 | | Lat: | 42.28 | | Lon: | 59.7 | | Source: | | | PointID: | 1252 | | Area Units: | km2 | | Discharge Units: | m3/sec | | Starting Year: | 1931 | | Ending Year: | 1973 | | Total Years: | 43 | | Total Usable Years: | 42 | |
| |
| Year | Jan | Feb | Mar | Apr | May | Jun | Jul | Aug | Sep | Oct | Nov | Dec | Avg Annual |
|---|
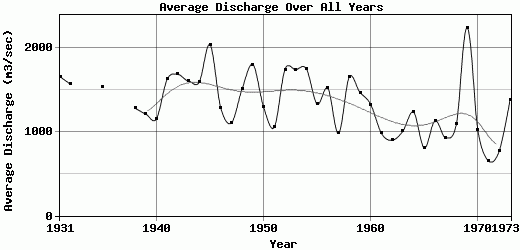
| 1931 | 607 | 790 | 846 | 1090 | 2020 | 2340 | 3200 | 3300 | 2490 | 1400 | 969 | 872 | 1660.33 |
| 1932 | 782 | 715 | 656 | 966 | 1590 | 2970 | 3660 | 3180 | 1630 | 1080 | 788 | 791 | 1567.33 |
| 1933 | 560 | 798 | 1030 | 833 | 1390 | 2450 | 3220 | 3380 | 1890 | -9999 | -9999 | -9999 | -9999 |
| 1934 | -9999 | -9999 | -9999 | -9999 | 1940 | 4040 | 5760 | 4500 | 2210 | 1330 | 993 | 724 | -9999 |
| 1935 | 548 | 937 | 765 | 820 | 1640 | 2000 | 3800 | 3540 | 1490 | 1010 | 981 | 913 | 1537 |
| 1936 | 637 | 561 | 532 | 826 | 2170 | 3970 | 3330 | 2480 | 1570 | 1130 | 796 | -9999 | -9999 |
| 1937 | -9999 | 929 | 590 | 863 | 1510 | 2660 | 2990 | 2450 | 1720 | 1000 | -9999 | -9999 | -9999 |
| 1938 | 789 | 577 | 690 | 819 | 2430 | 2450 | 1910 | 2320 | 1340 | 834 | 685 | 589 | 1286.08 |
| 1939 | 506 | 523 | 470 | 565 | 1720 | 2300 | 2270 | 2150 | 1700 | 919 | 801 | 639 | 1213.58 |
| 1940 | 458 | 397 | 545 | 495 | 1210 | 2510 | 2710 | 1940 | 1240 | 816 | 817 | 723 | 1155.08 |
| 1941 | 586 | 503 | 637 | 1080 | 2960 | 3740 | 3230 | 2620 | 1570 | 1110 | 820 | 678 | 1627.83 |
| 1942 | 553 | 439 | 574 | 1450 | 2400 | 2480 | 4630 | 3130 | 2010 | 940 | 826 | 821 | 1687.75 |
| 1943 | 423 | 516 | 1110 | 1020 | 1540 | 2720 | 3820 | 3120 | 1940 | 1200 | 987 | 899 | 1607.92 |
| 1944 | 859 | 676 | 639 | 1030 | 1800 | 1950 | 3570 | 3740 | 2110 | 1060 | 979 | 714 | 1593.92 |
| 1945 | 729 | 714 | 772 | 1490 | 2730 | 3700 | 4970 | 4030 | 2250 | 1300 | 966 | 851 | 2041.83 |
| 1946 | 758 | 750 | 520 | 824 | 1820 | 1930 | 2290 | 2570 | 1570 | 1110 | 854 | 478 | 1289.5 |
| 1947 | 581 | 641 | 525 | 532 | 871 | 1750 | 1690 | 2150 | 1810 | 1040 | 840 | 866 | 1108 |
| 1948 | 750 | 543 | 442 | 735 | 2190 | 2020 | 3140 | 3430 | 2000 | 1220 | 977 | 713 | 1513.33 |
| 1949 | 508 | 597 | 690 | 1570 | 3010 | 2820 | 4120 | 3570 | 1730 | 1210 | 918 | 931 | 1806.17 |
| 1950 | 447 | 484 | 687 | 532 | 1210 | 2380 | 2940 | 2850 | 1780 | 990 | 785 | 485 | 1297.5 |
| 1951 | 480 | 387 | 427 | 549 | 990 | 2000 | 1820 | 2100 | 1240 | 1070 | 939 | 666 | 1055.67 |
| 1952 | 639 | 517 | 610 | 1690 | 2780 | 3490 | 4310 | 2970 | 1520 | 1060 | 765 | 607 | 1746.5 |
| 1953 | 756 | 638 | 617 | 925 | 2250 | 3270 | 4510 | 2570 | 1890 | 1290 | 1150 | 1070 | 1744.67 |
| 1954 | 1100 | 844 | 522 | 1560 | 2380 | 3680 | 2990 | 3010 | 2200 | 1200 | 874 | 670 | 1752.5 |
| 1955 | 733 | 638 | 366 | 569 | 1220 | 2670 | 2520 | 3150 | 1690 | 958 | 753 | 713 | 1331.67 |
| 1956 | 567 | 783 | 621 | 910 | 2230 | 2630 | 3120 | 3420 | 1640 | 1090 | 706 | 542 | 1521.58 |
| 1957 | 478 | 670 | 397 | 324 | 677 | 1970 | 2580 | 1780 | 799 | 733 | 713 | 662 | 981.92 |
| 1958 | 572 | 440 | 265 | 1470 | 2230 | 2720 | 5030 | 3330 | 1490 | 1010 | 764 | 560 | 1656.75 |
| 1959 | 593 | 528 | 342 | 797 | 1560 | 2850 | 3430 | 2730 | 2160 | 1250 | 892 | 525 | 1471.42 |
| 1960 | 713 | 460 | 242 | 263 | 1470 | 2240 | 3690 | 2630 | 1780 | 929 | 814 | 704 | 1327.92 |
| 1961 | 495 | 411 | 204 | 398 | 1020 | 1860 | 1890 | 1960 | 1560 | 898 | 534 | 574 | 983.67 |
| 1962 | 622 | 366 | 223 | 393 | 1170 | 1430 | 1980 | 1580 | 1150 | 678 | 566 | 655 | 901.08 |
| 1963 | 454 | 331 | 186 | 415 | 1560 | 2210 | 2160 | 1550 | 1160 | 752 | 710 | 613 | 1008.42 |
| 1964 | 416 | 607 | 265 | 996 | 1620 | 1900 | 3400 | 2100 | 1390 | 991 | 650 | 502 | 1236.42 |
| 1965 | 453 | 413 | 243 | 319 | 959 | 1580 | 1500 | 1280 | 917 | 776 | 703 | 521 | 805.33 |
| 1966 | 496 | 132 | 41 | 449 | 1440 | 2500 | 2890 | 2120 | 1410 | 904 | 714 | 509 | 1133.75 |
| 1967 | 430 | 294 | 88 | 3 | 994 | 1750 | 2220 | 1970 | 1220 | 897 | 758 | 516 | 928.33 |
| 1968 | 251 | 144 | 21 | 198 | 1180 | 2480 | 3080 | 2520 | 1210 | 884 | 620 | 552 | 1095 |
| 1969 | 318 | 498 | 914 | 2190 | 2560 | 4800 | 5360 | 4720 | 2250 | 1310 | 1220 | 779 | 2243.25 |
| 1970 | 711 | 458 | 9.3 | 270 | 930 | 1790 | 2100 | 1330 | 2290 | 957 | 727 | 652 | 1018.69 |
| 1971 | 447 | 137 | 0.8 | 3.7 | 240 | 1330 | 1300 | 1450 | 1460 | 771 | 529 | 167 | 652.96 |
| 1972 | 0 | 28.5 | 163 | 202 | 1360 | 1400 | 2380 | 1130 | 1130 | 762 | 423 | 302 | 773.38 |
| 1973 | 307 | 158 | 4.2 | 1130 | 1830 | 3670 | 3710 | 2110 | 1820 | 991 | 527 | 279 | 1378.02 |
| |
|
|
|
|
|
|
|
|
|
|
|
|
|
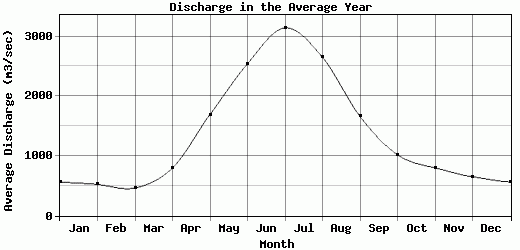
| Avg | 563.71 | 523.15 | 464.08 | 799.14 | 1693.05 | 2544.19 | 3144.65 | 2650.23 | 1661.07 | 1020.48 | 800.8 | 650.67 | 1352.36 |
| |
|
|
|
|
|
|
|
|
|
|
|
|
|
| Std Dev | 184.47 |
212.83 |
279.91 |
481.65 |
637.4 |
785.18 |
1052.65 |
837.06 |
390.67 |
179.01 |
164.82 |
180.21 |
356.23 |
| |
|
|
|
|
|
|
|
|
|
|
|
|
|
| | Jan | Feb | Mar | Apr | May | Jun | Jul | Aug | Sep | Oct | Nov | Dec | Avg Annual |
Click here for this table in tab-delimited format.
Tab-delimited format will open in most table browsing software, i.e. Excel, etc.
View this station on the map.
Return to start.