Results
| Country: | U.S.A.
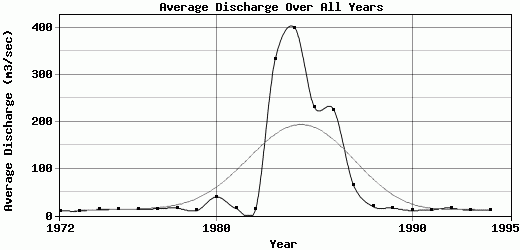
| | Station: | LEES FERRY, AZ. | | River: | COLORADO R | | Area: | 36439155.65 | | Lat: | 36.86 | | Lon: | -111.59 | | Source: | USGS | | PointID: | 9380000 | | Area Units: | km2 | | Discharge Units: | m3/sec | | Starting Year: | 1972 | | Ending Year: | 1995 | | Total Years: | 24 | | Total Usable Years: | 23 | |
| |
| Year | Jan | Feb | Mar | Apr | May | Jun | Jul | Aug | Sep | Oct | Nov | Dec | Avg Annual |
|---|
| 1972 | 8.01 | 7.8 | 10.48 | 11.23 | 9.4 | 10.56 | 11.26 | 11.17 | 8.35 | 18.28 | 9.07 | 9.2 | 10.4 |
| 1973 | 8.99 | 11 | 11.79 | 10.99 | 8.07 | 8.95 | 10.98 | 14.76 | 9.5 | 7.34 | 8.59 | 7.38 | 9.86 |
| 1974 | 12.21 | 7.22 | 12.02 | 10.87 | 27.11 | 9.93 | 11.49 | 11.48 | 21.78 | 9.08 | 9.14 | 13.49 | 12.99 |
| 1975 | 21.71 | 17.18 | 10.15 | 17.65 | 19.98 | 13.89 | 10.88 | 11.33 | 14.35 | 12.1 | 8.18 | 7.88 | 13.77 |
| 1976 | 6.63 | 8.5 | 10.42 | 14.68 | 21.22 | 21.9 | 11.7 | 11.01 | 29.76 | 12.75 | 13.12 | 7.71 | 14.12 |
| 1977 | 18.95 | 12.73 | 9.66 | 11.15 | 20.99 | 13.25 | 10.83 | 26.29 | 23.76 | 8.12 | 9.64 | 10.04 | 14.62 |
| 1978 | 35.24 | 11.99 | 17.34 | 9.78 | 21.26 | 10.05 | 10.97 | 10.08 | 23.74 | 14.95 | 12.32 | 13.05 | 15.9 |
| 1979 | 13.17 | 5.37 | 9.42 | 12.37 | 10.57 | 9.83 | 11.19 | 13.51 | 13 | 11.21 | 10.38 | 10.12 | 10.85 |
| 1980 | 11.2 | 12.95 | 28.32 | 47.46 | 38.31 | 45.69 | 58.42 | 44.56 | 39.93 | 37.79 | 51.62 | 66.02 | 40.19 |
| 1981 | 46.64 | 10.98 | 17.35 | 14.35 | 12.4 | 11.51 | 12.22 | 16.12 | 9.97 | 8.39 | 8.48 | 13.03 | 15.12 |
| 1982 | 11.54 | 10.56 | 21.25 | 14.87 | 15.47 | 14.95 | 12.57 | 18.47 | 15.52 | 8.46 | 9.15 | 15.39 | 14.02 |
| 1983 | 84.05 | 44.77 | 15.85 | 52.66 | 61.27 | 229.29 | 690.3 | 746.2 | 635.34 | 641.61 | 440.8 | 351.68 | 332.82 |
| 1984 | 436.72 | 440.87 | 389.31 | 357.21 | 316.92 | 428.91 | 479.84 | 436.08 | 353.21 | 321.45 | 394.27 | 444.03 | 399.9 |
| 1985 | 410.69 | 365.9 | 227.61 | 127.66 | 163.33 | 265.1 | 266.08 | 276.28 | 259.68 | 129.93 | 100.55 | 182.75 | 231.3 |
| 1986 | 287.34 | 206.55 | 212.06 | 195.09 | 351.05 | 338.4 | 245.61 | 206.16 | 180.55 | 122.68 | 157.04 | 200.98 | 225.29 |
| 1987 | 320.49 | 134.57 | 62.42 | 41.45 | 31.59 | 28.18 | 30.32 | 39.12 | 44.89 | 26.18 | 16.86 | 15.19 | 65.94 |
| 1988 | 18.22 | 18.55 | 15.97 | 22.52 | 19.41 | 17 | 17.72 | 28.23 | 23.77 | 18.07 | 16.99 | 16.1 | 19.38 |
| 1989 | 15.28 | 13.43 | 15.39 | 17.6 | 16.06 | 15.81 | 19.12 | 23.8 | 18.24 | 15.41 | 13.26 | 12.07 | 16.29 |
| 1990 | 9.63 | 10.62 | 11.63 | 12.04 | 10.22 | 10.38 | 11.69 | 12.61 | 13.03 | 9.4 | 10.06 | 10.64 | 11 |
| 1991 | 10.52 | 8.39 | 17.76 | 13.15 | 12.12 | 11.97 | 10.95 | 12.13 | 15.05 | 10.33 | 10.27 | 13.86 | 12.21 |
| 1992 | 14.27 | 13.76 | 35.26 | 13.7 | 10.9 | 11.51 | 11.87 | 18.89 | 17.71 | 15.24 | 11.78 | 18.22 | 16.09 |
| 1993 | 11.46 | 8.91 | 22.75 | 13.68 | 11.31 | 12.96 | 9.37 | 10.54 | 10.5 | 9.74 | 7.75 | 9.68 | 11.55 |
| 1994 | 7.71 | 12.3 | 17.21 | 12.24 | 16.7 | 10.73 | 9.55 | 12.19 | 10.58 | 8.62 | 8.45 | 11.46 | 11.48 |
| 1995 | -9999 | -9999 | -9999 | -9999 | -9999 | -9999 | -9999 | -9999 | -9999 | -9999 | -9999 | -9999 | -9999 |
| |
|
|
|
|
|
|
|
|
|
|
|
|
|
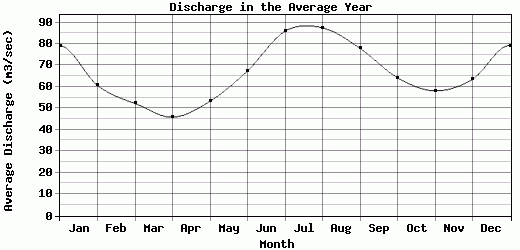
| Avg | 79.16 | 60.65 | 52.24 | 45.84 | 53.29 | 67.42 | 85.87 | 87.44 | 77.92 | 64.22 | 58.16 | 63.48 | 66.31 |
| |
|
|
|
|
|
|
|
|
|
|
|
|
|
| Std Dev | 134.13 |
115.89 |
92.16 |
79.05 |
92.27 |
118.42 |
171.34 |
174.22 |
147.09 |
140.91 |
116.39 |
115.92 |
110.92 |
| |
|
|
|
|
|
|
|
|
|
|
|
|
|
| | Jan | Feb | Mar | Apr | May | Jun | Jul | Aug | Sep | Oct | Nov | Dec | Avg Annual |
Click here for this table in tab-delimited format.
Tab-delimited format will open in most table browsing software, i.e. Excel, etc.
View this station on the map.
Return to start.