Results
| Country: | Canada
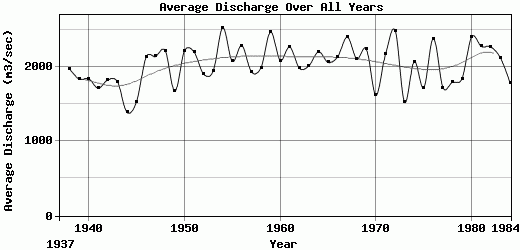
| | Station: | Birchbank | | River: | Columbia | | Area: | 88100 km2 | | Lat: | 49.18 | | Lon: | -117.72 | | Source: | RivDIS | | PointID: | 1156 | | Area Units: | km2 | | Discharge Units: | m3/sec | | Starting Year: | 1937 | | Ending Year: | 1984 | | Total Years: | 48 | | Total Usable Years: | 47 | |
| |
| Year | Jan | Feb | Mar | Apr | May | Jun | Jul | Aug | Sep | Oct | Nov | Dec | Avg Annual |
|---|
| 1937 | -9999 | -9999 | -9999 | -9999 | -9999 | -9999 | -9999 | -9999 | -9999 | 886 | 1240 | 776 | -9999 |
| 1938 | 612 | 489 | 498 | 1050 | 3260 | 6580 | 4950 | 2240 | 1660 | 1130 | 697 | 555 | 1976.75 |
| 1939 | 515 | 450 | 414 | 1000 | 3890 | 4470 | 4200 | 2530 | 1550 | 1070 | 1070 | 883 | 1836.83 |
| 1940 | 627 | 551 | 649 | 1220 | 3230 | 5020 | 3710 | 2330 | 1840 | 1360 | 968 | 602 | 1842.25 |
| 1941 | 513 | 491 | 612 | 1290 | 2800 | 3840 | 3060 | 2240 | 1850 | 1600 | 1150 | 1140 | 1715.5 |
| 1942 | 647 | 625 | 612 | 876 | 2630 | 5240 | 4820 | 2810 | 1370 | 1010 | 711 | 579 | 1827.5 |
| 1943 | 505 | 472 | 457 | 1560 | 2580 | 4490 | 5220 | 2840 | 1310 | 924 | 685 | 568 | 1800.92 |
| 1944 | 507 | 435 | 401 | 565 | 1960 | 3980 | 2590 | 2190 | 1490 | 1130 | 847 | 596 | 1390.92 |
| 1945 | 505 | 497 | 496 | 516 | 2140 | 5010 | 3840 | 2160 | 1290 | 799 | 665 | 514 | 1536 |
| 1946 | 473 | 473 | 626 | 1090 | 4420 | 7090 | 5040 | 2710 | 1610 | 892 | 592 | 554 | 2130.83 |
| 1947 | 511 | 604 | 740 | 1250 | 4410 | 6110 | 4570 | 2430 | 1440 | 1790 | 1190 | 684 | 2144.08 |
| 1948 | 604 | 549 | 573 | 835 | 3480 | 9020 | 4390 | 2800 | 1770 | 1150 | 824 | 631 | 2218.83 |
| 1949 | 508 | 449 | 480 | 1000 | 4200 | 4730 | 2830 | 2140 | 1370 | 858 | 729 | 764 | 1671.5 |
| 1950 | 545 | 567 | 772 | 879 | 2370 | 6510 | 6930 | 2990 | 1760 | 1260 | 1050 | 938 | 2214.25 |
| 1951 | 850 | 997 | 732 | 1150 | 4360 | 5420 | 5720 | 2790 | 1520 | 1380 | 842 | 678 | 2203.25 |
| 1952 | 599 | 562 | 612 | 1110 | 4030 | 5540 | 4510 | 2490 | 1310 | 1010 | 618 | 480 | 1905.92 |
| 1953 | 484 | 566 | 637 | 632 | 2860 | 5870 | 5050 | 2600 | 1650 | 1140 | 1030 | 815 | 1944.5 |
| 1954 | 639 | 563 | 737 | 771 | 3280 | 6850 | 7840 | 3950 | 2400 | 1280 | 1080 | 937 | 2527.25 |
| 1955 | 668 | 616 | 535 | 703 | 1710 | 6070 | 6850 | 3250 | 1530 | 1120 | 1120 | 742 | 2076.17 |
| 1956 | 684 | 542 | 639 | 1360 | 4290 | 8000 | 5100 | 2800 | 1420 | 1230 | 779 | 605 | 2287.42 |
| 1957 | 507 | 550 | 592 | 779 | 5350 | 6250 | 3500 | 2170 | 1270 | 1010 | 687 | 536 | 1933.42 |
| 1958 | 530 | 594 | 711 | 956 | 4030 | 6750 | 3710 | 2340 | 1510 | 1250 | 906 | 645 | 1994.33 |
| 1959 | 686 | 572 | 637 | 1030 | 3300 | 6970 | 6460 | 3230 | 2560 | 1880 | 1390 | 948 | 2471.92 |
| 1960 | 673 | 647 | 717 | 1710 | 2760 | 5440 | 5780 | 2950 | 1520 | 1200 | 1050 | 617 | 2088.67 |
| 1961 | 603 | 786 | 817 | 1090 | 3470 | 9340 | 4490 | 2640 | 1510 | 1100 | 824 | 583 | 2271.08 |
| 1962 | 512 | 625 | 614 | 1190 | 2750 | 5660 | 4740 | 3080 | 1540 | 1150 | 1070 | 884 | 1984.58 |
| 1963 | 707 | 780 | 804 | 1070 | 2650 | 6030 | 4610 | 3160 | 1710 | 1130 | 875 | 653 | 2014.92 |
| 1964 | 659 | 521 | 505 | 738 | 2440 | 6960 | 6250 | 3280 | 1580 | 1700 | 1110 | 725 | 2205.67 |
| 1965 | 630 | 650 | 730 | 1055 | 3130 | 6040 | 4810 | 3290 | 1540 | 1100 | 1075 | 720 | 2064.17 |
| 1966 | 634 | 592 | 682 | 1290 | 3430 | 6400 | 5300 | 2920 | 1600 | 1190 | 909 | 682 | 2135.75 |
| 1967 | 725 | 875 | 578 | 753 | 2420 | 8350 | 6680 | 3200 | 1820 | 1370 | 1010 | 1030 | 2400.92 |
| 1968 | 614 | 758 | 961 | 854 | 2640 | 6230 | 5340 | 2940 | 1840 | 1240 | 962 | 976 | 2112.92 |
| 1969 | 1050 | 977 | 978 | 1720 | 3780 | 5470 | 4080 | 2480 | 1500 | 1380 | 1640 | 1830 | 2240.42 |
| 1970 | 1620 | 711 | 698 | 678 | 2010 | 3080 | 2820 | 2360 | 1560 | 1280 | 1330 | 1320 | 1622.25 |
| 1971 | 1220 | 954 | 957 | 951 | 3850 | 5210 | 3940 | 3110 | 1420 | 1160 | 1460 | 1840 | 2172.67 |
| 1972 | 1590 | 994 | 1120 | 1280 | 3030 | 6510 | 4780 | 3480 | 1920 | 1590 | 1510 | 2100 | 2492 |
| 1973 | 1730 | 1230 | 674 | 1070 | 1570 | 2080 | 2970 | 2790 | 2080 | 1660 | 309 | 172 | 1527.92 |
| 1974 | 968 | 1120 | 1124 | 1036 | 2565 | 3370 | 3483 | 3115 | 2367 | 1869 | 1897 | 1976 | 2074.17 |
| 1975 | 2070 | 2140 | 1570 | 1490 | 1490 | 2070 | 1680 | 2190 | 1220 | 1180 | 1740 | 1820 | 1721.67 |
| 1976 | 2200 | 1960 | 1710 | 1310 | 2480 | 2280 | 3470 | 4390 | 2780 | 2060 | 1830 | 2140 | 2384.17 |
| 1977 | 2040 | 1520 | 1440 | 1520 | 2160 | 2300 | 2240 | 2090 | 1730 | 1150 | 1510 | 993 | 1724.42 |
| 1978 | 1240 | 1360 | 1410 | 1170 | 1950 | 1880 | 2340 | 2100 | 2300 | 1880 | 1730 | 2200 | 1796.67 |
| 1979 | 2810 | 1710 | 1270 | 1250 | 1840 | 1640 | 2010 | 2400 | 1640 | 1530 | 1550 | 2500 | 1845.83 |
| 1980 | 2114 | 1957 | 1494 | 1826 | 3572 | 3727 | 2935 | 2514 | 1704 | 1870 | 2165 | 3008 | 2407.17 |
| 1981 | 2860 | 2630 | 1450 | 924 | 2020 | 3310 | 3810 | 3530 | 1850 | 1460 | 1470 | 2040 | 2279.5 |
| 1982 | 2660 | 1780 | 2070 | 2290 | 2610 | 2690 | 3290 | 2980 | 1970 | 1530 | 1570 | 1780 | 2268.33 |
| 1983 | 2580 | 2440 | 2140 | 1780 | 2360 | 2470 | 2410 | 2770 | 1520 | 1270 | 1440 | 2300 | 2123.33 |
| 1984 | 2260 | 2450 | 1640 | 721 | 1830 | 1740 | 1950 | 2650 | 1490 | 1340 | 1190 | 2240 | 1791.75 |
| |
|
|
|
|
|
|
|
|
|
|
|
|
|
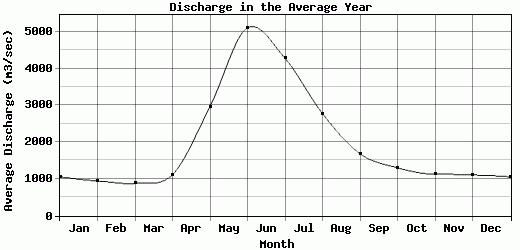
| Avg | 1052.94 | 944.28 | 879.04 | 1114.64 | 2965.68 | 5108.23 | 4278.68 | 2775.3 | 1684.91 | 1303.08 | 1127 | 1110.4 | 2029.81 |
| |
|
|
|
|
|
|
|
|
|
|
|
|
|
| Std Dev | 729.64 |
602.58 |
432.63 |
360.58 |
887.59 |
1962.63 |
1434.14 |
491.33 |
337.51 |
301.04 |
391.32 |
673.29 |
268.75 |
| |
|
|
|
|
|
|
|
|
|
|
|
|
|
| | Jan | Feb | Mar | Apr | May | Jun | Jul | Aug | Sep | Oct | Nov | Dec | Avg Annual |
Click here for this table in tab-delimited format.
Tab-delimited format will open in most table browsing software, i.e. Excel, etc.
View this station on the map.
Return to start.