Results
| Country: | U.S.A.
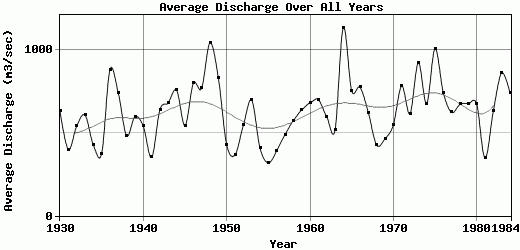
| | Station: | Chattahoochee,Florida | | River: | Apalachicola | | Area: | 44548 km2 | | Lat: | 30.7 | | Lon: | -84.86 | | Source: | | | PointID: | 399 | | Area Units: | km2 | | Discharge Units: | m3/sec | | Starting Year: | 1930 | | Ending Year: | 1984 | | Total Years: | 55 | | Total Usable Years: | 55 | |
| |
| Year | Jan | Feb | Mar | Apr | May | Jun | Jul | Aug | Sep | Oct | Nov | Dec | Avg Annual |
|---|
| 1930 | 770 | 991 | 1093 | 889 | 526 | 404 | 319 | 334 | 421 | 328 | 821 | 662 | 629.83 |
| 1931 | 662 | 566 | 572 | 617 | 555 | 252 | 255 | 328 | 204 | 169 | 156 | 421 | 396.42 |
| 1932 | 824 | 812 | 665 | 538 | 447 | 438 | 416 | 495 | 278 | 351 | 436 | 773 | 539.42 |
| 1933 | 1050 | 1217 | 1163 | 1076 | 605 | 390 | 407 | 345 | 322 | 229 | 223 | 252 | 606.58 |
| 1934 | 302 | 317 | 877 | 501 | 495 | 600 | 416 | 379 | 283 | 402 | 245 | 299 | 426.33 |
| 1935 | 340 | 392 | 777 | 585 | 410 | 252 | 312 | 331 | 358 | 199 | 263 | 274 | 374.42 |
| 1936 | 1768 | 1838 | 927 | 2043 | 568 | 364 | 397 | 696 | 331 | 590 | 344 | 701 | 880.58 |
| 1937 | 1149 | 1163 | 1057 | 1252 | 978 | 467 | 446 | 434 | 499 | 435 | 504 | 478 | 738.5 |
| 1938 | 491 | 401 | 544 | 1448 | 500 | 432 | 541 | 455 | 272 | 231 | 218 | 245 | 481.5 |
| 1939 | 333 | 770 | 1348 | 884 | 593 | 617 | 476 | 752 | 496 | 350 | 258 | 287 | 597 |
| 1940 | 548 | 1033 | 856 | 751 | 436 | 369 | 907 | 415 | 293 | 203 | 275 | 379 | 538.75 |
| 1941 | 474 | 410 | 539 | 474 | 278 | 202 | 395 | 314 | 214 | 197 | 180 | 530 | 350.58 |
| 1942 | 900 | 888 | 1503 | 905 | 470 | 556 | 463 | 509 | 365 | 344 | 310 | 466 | 639.92 |
| 1943 | 1276 | 928 | 1777 | 998 | 686 | 483 | 489 | 429 | 276 | 238 | 282 | 311 | 681.08 |
| 1944 | 572 | 675 | 1572 | 2285 | 1204 | 492 | 442 | 434 | 440 | 299 | 273 | 380 | 755.67 |
| 1945 | 443 | 848 | 754 | 548 | 784 | 353 | 441 | 424 | 412 | 349 | 395 | 755 | 542.17 |
| 1946 | 1656 | 1089 | 1029 | 1158 | 1079 | 783 | 584 | 683 | 427 | 368 | 373 | 337 | 797.17 |
| 1947 | 936 | 637 | 1264 | 1280 | 810 | 704 | 566 | 487 | 339 | 293 | 748 | 1156 | 768.33 |
| 1948 | 836 | 1340 | 1838 | 1731 | 575 | 496 | 1071 | 828 | 484 | 516 | 799 | 1993 | 1042.25 |
| 1949 | 1294 | 1506 | 1072 | 1028 | 1110 | 652 | 882 | 669 | 558 | 401 | 376 | 431 | 831.58 |
| 1950 | 454 | 508 | 765 | 611 | 439 | 455 | 340 | 321 | 407 | 254 | 248 | 332 | 427.83 |
| 1951 | 404 | 374 | 460 | 687 | 384 | 270 | 280 | 230 | 206 | 204 | 316 | 581 | 366.33 |
| 1952 | 538 | 828 | 1666 | 899 | 564 | 479 | 262 | 279 | 274 | 204 | 204 | 328 | 543.75 |
| 1953 | 689 | 793 | 901 | 841 | 1273 | 442 | 641 | 401 | 380 | 480 | 317 | 1214 | 697.67 |
| 1954 | 981 | 658 | 690 | 608 | 375 | 307 | 302 | 231 | 172 | 150 | 169 | 249 | 407.67 |
| 1955 | 397 | 550 | 361 | 547 | 345 | 223 | 352 | 309 | 193 | 155 | 167 | 226 | 318.75 |
| 1956 | 205 | 588 | 783 | 682 | 383 | 243 | 287 | 218 | 298 | 319 | 217 | 463 | 390.5 |
| 1957 | 409 | 378 | 643 | 1128 | 679 | 357 | 289 | 198 | 242 | 413 | 438 | 678 | 487.67 |
| 1958 | 558 | 830 | 1308 | 1115 | 525 | 406 | 562 | 429 | 299 | 271 | 255 | 320 | 573.17 |
| 1959 | 481 | 1060 | 1246 | 872 | 534 | 903 | 446 | 360 | 349 | 441 | 468 | 480 | 636.67 |
| 1960 | 756 | 1372 | 1126 | 1856 | 579 | 390 | 371 | 384 | 339 | 373 | 287 | 328 | 680.08 |
| 1961 | 359 | 928 | 1343 | 1618 | 833 | 567 | 575 | 460 | 399 | 236 | 246 | 828 | 699.33 |
| 1962 | 918 | 874 | 1190 | 1429 | 502 | 422 | 357 | 291 | 269 | 261 | 296 | 355 | 597 |
| 1963 | 797 | 871 | 675 | 592 | 577 | 506 | 500 | 345 | 250 | 260 | 259 | 535 | 513.92 |
| 1964 | 1472 | 1379 | 1838 | 2019 | 1508 | 476 | 736 | 789 | 500 | 1090 | 611 | 1170 | 1132.33 |
| 1965 | 1103 | 1484 | 1436 | 1111 | 489 | 745 | 575 | 405 | 371 | 490 | 370 | 454 | 752.75 |
| 1966 | 947 | 1636 | 2058 | 680 | 786 | 594 | 383 | 456 | 328 | 363 | 570 | 489 | 774.17 |
| 1967 | 1292 | 1012 | 677 | 404 | 380 | 452 | 584 | 464 | 521 | 352 | 472 | 846 | 621.33 |
| 1968 | 833 | 478 | 849 | 531 | 375 | 335 | 315 | 301 | 256 | 218 | 248 | 360 | 424.92 |
| 1969 | 441 | 530 | 681 | 847 | 592 | 375 | 308 | 360 | 391 | 354 | 314 | 375 | 464 |
| 1970 | 503 | 659 | 1130 | 1050 | 365 | 496 | 371 | 478 | 363 | 291 | 435 | 417 | 546.5 |
| 1971 | 868 | 1080 | 1890 | 969 | 854 | 450 | 581 | 709 | 400 | 362 | 340 | 879 | 781.83 |
| 1972 | 1200 | 1170 | 900 | 552 | 411 | 484 | 476 | 369 | 291 | 273 | 294 | 958 | 614.83 |
| 1973 | 1320 | 1680 | 1260 | 2000 | 1080 | 1120 | 513 | 519 | 387 | 332 | 359 | 482 | 921 |
| 1974 | 1210 | 1670 | 731 | 1180 | 522 | 447 | 338 | 419 | 418 | 299 | 295 | 574 | 675.25 |
| 1975 | 1070 | 1530 | 1840 | 1970 | 756 | 782 | 764 | 824 | 470 | 778 | 657 | 621 | 1005.17 |
| 1976 | 891 | 941 | 1090 | 811 | 1020 | 804 | 565 | 388 | 349 | 420 | 505 | 1108 | 741 |
| 1977 | 1110 | 620 | 1490 | 1060 | 407 | 333 | 275 | 337 | 315 | 283 | 716 | 520 | 622.17 |
| 1978 | 1380 | 1200 | 1290 | 714 | 1010 | 500 | 323 | 536 | 325 | 267 | 240 | 263 | 670.67 |
| 1979 | 578 | 1160 | 1260 | 1550 | 740 | 419 | 377 | 340 | 378 | 398 | 463 | 443 | 675.5 |
| 1980 | 566 | 731 | 1812 | 1769 | 942 | 484 | 398 | 334 | 274 | 258 | 256 | 257 | 673.42 |
| 1981 | 256 | 811 | 454 | 677 | 295 | 289 | 273 | 262 | 257 | 201 | 159 | 216 | 345.83 |
| 1982 | 803 | 1379 | 628 | 692 | 515 | 397 | 451 | 598 | 379 | 351 | 360 | 1008 | 630.08 |
| 1983 | 1053 | 1429 | 1663 | 1651 | 636 | 555 | 485 | 377 | 372 | 358 | 412 | 1336 | 860.58 |
| 1984 | 1157 | 1072 | 1448 | 1052 | 917 | 495 | 442 | 853 | 426 | 307 | 312 | 386 | 738.92 |
| |
|
|
|
|
|
|
|
|
|
|
|
|
|
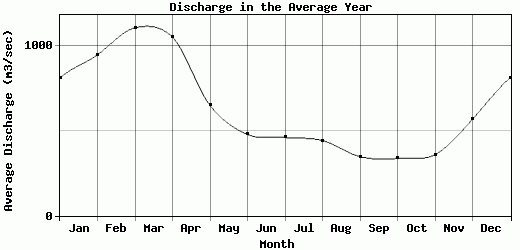
| Avg | 811.33 | 946.98 | 1105.62 | 1050.27 | 649.11 | 478.33 | 460.4 | 442.09 | 347.64 | 337.42 | 359.16 | 567.44 | 629.65 |
| |
|
|
|
|
|
|
|
|
|
|
|
|
|
| Std Dev | 373.05 |
385.3 |
433.3 |
480.41 |
271.86 |
174.18 |
167.45 |
162.56 |
88.43 |
151.66 |
160.45 |
342.38 |
180.35 |
| |
|
|
|
|
|
|
|
|
|
|
|
|
|
| | Jan | Feb | Mar | Apr | May | Jun | Jul | Aug | Sep | Oct | Nov | Dec | Avg Annual |
Click here for this table in tab-delimited format.
Tab-delimited format will open in most table browsing software, i.e. Excel, etc.
View this station on the map.
Return to start.