Results
|
|
| Year | Jan | Feb | Mar | Apr | May | Jun | Jul | Aug | Sep | Oct | Nov | Dec | Avg Annual |
|---|---|---|---|---|---|---|---|---|---|---|---|---|---|
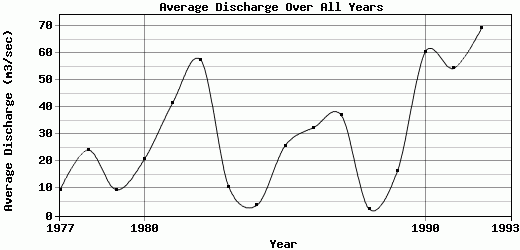
| 1977 | 14.98 | 3.63 | 1.53 | 25.42 | 34.89 | 4.77 | 7.83 | 3.3 | 6.09 | 3.95 | 2.37 | 3.2 | 9.33 |
| 1978 | 3.33 | 2.18 | 1.04 | 0.57 | 3.04 | 1.91 | 1.89 | 242.11 | 15.74 | 9.77 | 6.13 | 3 | 24.23 |
| 1979 | 4.81 | 3.68 | 4.73 | 10.05 | 32.5 | 27.93 | 3.45 | 6.5 | 12.07 | 5.06 | 2.69 | 1.68 | 9.6 |
| 1980 | 4.33 | 3.25 | 2.14 | 2.08 | 21.49 | 22.73 | 16.92 | 8.95 | 15.78 | 122.5 | 5.34 | 23.35 | 20.74 |
| 1981 | 20.3 | 8.09 | 12.07 | 6.62 | 21.13 | 49.62 | 17.26 | 5.88 | 5.38 | 328.9 | 17.23 | 4.87 | 41.45 |
| 1982 | 6.92 | 11.07 | 6.6 | 1.98 | 242.05 | 326.73 | 72.98 | 6.76 | 2.56 | 1.47 | 7.05 | 3.54 | 57.48 |
| 1983 | 4.68 | 4.48 | 9.5 | 12.23 | 6.8 | 15.19 | 16.8 | 12.14 | 8.62 | 10.51 | 5.62 | 21.88 | 10.7 |
| 1984 | 12.89 | 6.2 | 1.63 | 4.18 | 1.33 | 6.64 | 6.26 | 1.32 | 0.97 | 0.71 | 1.23 | 2.89 | 3.85 |
| 1985 | 33.57 | 19.39 | 36.94 | 44.39 | 44.01 | 51.41 | 15.59 | 20.73 | 9.93 | 16.03 | 11 | 5.32 | 25.69 |
| 1986 | 8.1 | 4.97 | 6.06 | 2.34 | 2.05 | 50.8 | 30.12 | 8.62 | 40.58 | 170.42 | 36.6 | 27.98 | 32.39 |
| 1987 | 23.77 | 51.67 | 62.46 | 96.06 | 26.2 | 143.33 | 18.47 | 4.32 | 5.2 | 3.8 | 2.38 | 7.2 | 37.07 |
| 1988 | 4.25 | 2.06 | 3.88 | 2.18 | 0.75 | 0.93 | 1.22 | 2.15 | 0.71 | 2.81 | 4.04 | 4.04 | 2.42 |
| 1989 | 2.34 | 5.34 | 10.29 | 4.13 | 43.58 | 42.31 | 7.64 | 22.14 | 37.66 | 6.78 | 3.41 | 11.87 | 16.46 |
| 1990 | 3.26 | 2.98 | 48.89 | 225.18 | 240.77 | 109.99 | 7.12 | 16.47 | 40.13 | 14.86 | 8.56 | 8.81 | 60.59 |
| 1991 | 11.59 | 7.92 | 15.92 | 9.61 | 34.59 | 205.26 | 19.88 | 31.89 | 42.68 | 51.5 | 18.59 | 203.1 | 54.38 |
| 1992 | 62.22 | 245.21 | 140.11 | 34.98 | 31.27 | 227.21 | 34.01 | 23.7 | 13.2 | 4.01 | 8.51 | 7.31 | 69.31 |
| 1993 | -9999 | -9999 | -9999 | -9999 | -9999 | -9999 | -9999 | -9999 | -9999 | -9999 | -9999 | -9999 | -9999 |
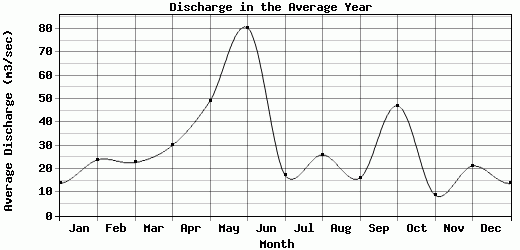
| Avg | 13.83 | 23.88 | 22.74 | 30.13 | 49.15 | 80.42 | 17.34 | 26.06 | 16.08 | 47.07 | 8.8 | 21.25 | 29.73 |
| Std Dev | 15.13 | 58.34 | 35.12 | 55.73 | 74.1 | 93.79 | 17.05 | 56.45 | 14.68 | 86.69 | 8.68 | 47.61 | 20.91 |
| Jan | Feb | Mar | Apr | May | Jun | Jul | Aug | Sep | Oct | Nov | Dec | Avg Annual |
Click here for this table in tab-delimited format.
Tab-delimited format will open in most table browsing software, i.e. Excel, etc.