Results
| Country: | U.S.A.
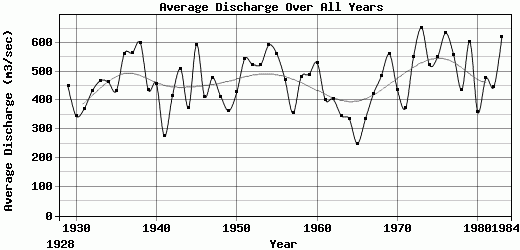
| | Station: | Thompsonville,Connecticut | | River: | Connecticut | | Area: | 25022 km2 | | Lat: | 41.98 | | Lon: | -72.6 | | Source: | RivDIS | | PointID: | 415 | | Area Units: | km2 | | Discharge Units: | m3/sec | | Starting Year: | 1928 | | Ending Year: | 1984 | | Total Years: | 57 | | Total Usable Years: | 56 | |
| |
| Year | Jan | Feb | Mar | Apr | May | Jun | Jul | Aug | Sep | Oct | Nov | Dec | Avg Annual |
|---|
| 1928 | -9999 | -9999 | -9999 | -9999 | -9999 | -9999 | -9999 | 385 | 336 | 281 | 286 | 263 | -9999 |
| 1929 | 342 | 251 | 1016 | 1393 | 1093 | 280 | 182 | 137 | 139 | 147 | 199 | 215 | 449.5 |
| 1930 | 393 | 362 | 696 | 801 | 518 | 458 | 210 | 141 | 97 | 101 | 205 | 177 | 346.58 |
| 1931 | 122 | 126 | 345 | 1203 | 693 | 566 | 294 | 168 | 177 | 174 | 255 | 317 | 370 |
| 1932 | 557 | 387 | 328 | 1376 | 450 | 209 | 225 | 156 | 159 | 274 | 736 | 328 | 432.08 |
| 1933 | 393 | 334 | 410 | 2072 | 685 | 237 | 113 | 207 | 328 | 265 | 275 | 294 | 467.75 |
| 1934 | 329 | 197 | 531 | 1981 | 662 | 300 | 153 | 102 | 216 | 234 | 436 | 427 | 464 |
| 1935 | 647 | 308 | 729 | 933 | 697 | 499 | 342 | 152 | 157 | 142 | 260 | 316 | 431.83 |
| 1936 | 290 | 189 | 2525 | 1265 | 689 | 214 | 143 | 110 | 134 | 285 | 363 | 540 | 562.25 |
| 1937 | 780 | 578 | 377 | 1154 | 1390 | 503 | 278 | 172 | 181 | 284 | 566 | 520 | 565.25 |
| 1938 | 556 | 592 | 679 | 862 | 484 | 279 | 404 | 355 | 1209 | 466 | 407 | 906 | 599.92 |
| 1939 | 381 | 356 | 562 | 1553 | 926 | 304 | 162 | 151 | 113 | 165 | 313 | 249 | 436.25 |
| 1940 | 154 | 124 | 197 | 1634 | 1418 | 514 | 221 | 122 | 164 | 133 | 452 | 355 | 457.33 |
| 1941 | 383 | 389 | 270 | 829 | 272 | 169 | 161 | 112 | 107 | 133 | 248 | 233 | 275.5 |
| 1942 | 317 | 204 | 775 | 1230 | 608 | 405 | 172 | 100 | 111 | 182 | 479 | 408 | 415.92 |
| 1943 | 307 | 323 | 761 | 946 | 1320 | 496 | 207 | 312 | 212 | 273 | 673 | 290 | 510 |
| 1944 | 187 | 179 | 429 | 1280 | 761 | 351 | 174 | 121 | 181 | 252 | 271 | 318 | 375.33 |
| 1945 | 362 | 257 | 1251 | 1095 | 1207 | 650 | 431 | 199 | 216 | 500 | 504 | 457 | 594.08 |
| 1946 | 445 | 344 | 1125 | 568 | 691 | 441 | 147 | 195 | 134 | 292 | 284 | 284 | 412.5 |
| 1947 | 327 | 473 | 696 | 1353 | 1022 | 773 | 299 | 181 | 124 | 96 | 248 | 157 | 479.08 |
| 1948 | 138 | 197 | 1031 | 1041 | 893 | 563 | 229 | 134 | 89 | 87 | 300 | 264 | 413.83 |
| 1949 | 840 | 452 | 685 | 834 | 459 | 173 | 93 | 89 | 112 | 118 | 201 | 309 | 363.75 |
| 1950 | 480 | 354 | 533 | 1317 | 542 | 336 | 119 | 116 | 159 | 129 | 406 | 644 | 427.92 |
| 1951 | 385 | 610 | 647 | 1760 | 514 | 261 | 246 | 218 | 197 | 336 | 804 | 561 | 544.92 |
| 1952 | 636 | 553 | 587 | 1805 | 814 | 794 | 169 | 128 | 120 | 122 | 159 | 411 | 524.83 |
| 1953 | 465 | 659 | 1430 | 1411 | 1078 | 194 | 100 | 109 | 79 | 105 | 170 | 495 | 524.58 |
| 1954 | 227 | 451 | 734 | 1344 | 1107 | 514 | 221 | 178 | 662 | 351 | 685 | 634 | 592.33 |
| 1955 | 365 | 302 | 692 | 1623 | 566 | 376 | 115 | 637 | 175 | 699 | 897 | 283 | 560.83 |
| 1956 | 408 | 274 | 351 | 1429 | 1281 | 472 | 207 | 91 | 230 | 212 | 295 | 423 | 472.75 |
| 1957 | 377 | 338 | 598 | 702 | 403 | 199 | 198 | 125 | 104 | 130 | 311 | 781 | 355.5 |
| 1958 | 494 | 365 | 479 | 1795 | 922 | 293 | 212 | 184 | 155 | 255 | 343 | 269 | 480.5 |
| 1959 | 327 | 284 | 454 | 1487 | 404 | 234 | 151 | 107 | 141 | 529 | 854 | 912 | 490.33 |
| 1960 | 529 | 540 | 377 | 2153 | 687 | 397 | 179 | 169 | 343 | 304 | 389 | 302 | 530.75 |
| 1961 | 200 | 312 | 725 | 1230 | 857 | 413 | 207 | 135 | 146 | 121 | 216 | 277 | 403.25 |
| 1962 | 293 | 188 | 357 | 1497 | 650 | 165 | 90 | 227 | 124 | 395 | 481 | 385 | 404.33 |
| 1963 | 235 | 188 | 469 | 1419 | 673 | 165 | 97 | 130 | 109 | 76 | 308 | 302 | 347.58 |
| 1964 | 356 | 319 | 815 | 1160 | 475 | 138 | 128 | 93 | 76 | 97 | 142 | 231 | 335.83 |
| 1965 | 194 | 252 | 349 | 634 | 298 | 166 | 91 | 82 | 136 | 243 | 292 | 264 | 250.08 |
| 1966 | 247 | 296 | 698 | 771 | 566 | 245 | 116 | 120 | 162 | 195 | 321 | 275 | 334.33 |
| 1967 | 244 | 236 | 294 | 1377 | 964 | 437 | 222 | 164 | 220 | 211 | 255 | 441 | 422.08 |
| 1968 | 251 | 295 | 964 | 871 | 540 | 596 | 275 | 113 | 965 | 116 | 291 | 554 | 485.92 |
| 1969 | 298 | 293 | 530 | 1960 | 993 | 371 | 229 | 445 | 185 | 156 | 734 | 533 | 560.58 |
| 1970 | 372 | 743 | 482 | 1520 | 846 | 240 | 136 | 90.5 | 134 | 215 | 218 | 231 | 435.63 |
| 1971 | 149 | 213 | 408 | 1220 | 1160 | 200 | 97.5 | 164 | 152 | 171 | 174 | 360 | 372.38 |
| 1972 | 322 | 272 | 667 | 1260 | 1440 | 609 | 448 | 198 | 109 | 156 | 519 | 624 | 552 |
| 1973 | 694 | 683 | 1200 | 1150 | 897 | 534 | 816 | 207 | 169 | 201 | 284 | 991 | 652.17 |
| 1974 | 623 | 543 | 735 | 1260 | 992 | 335 | 259 | 126 | 259 | 277 | 409 | 444 | 521.83 |
| 1975 | 364 | 390 | 742 | 1050 | 627 | 379 | 249 | 218 | 409 | 871 | 775 | 539 | 551.08 |
| 1976 | 500 | 858 | 1120 | 1300 | 952 | 319 | 283 | 612 | 248 | 579 | 473 | 362 | 633.83 |
| 1977 | 218 | 224 | 1220 | 1410 | 536 | 247 | 140 | 183 | 288 | 888 | 661 | 667 | 556.83 |
| 1978 | 846 | 448 | 509 | 1280 | 790 | 483 | 143 | 156 | 95 | 158 | 164 | 170 | 436.83 |
| 1979 | 576 | 305 | 1670 | 1320 | 895 | 444 | 178 | 180 | 248 | 471 | 481 | 470 | 603.17 |
| 1980 | 346 | 184 | 663 | 1107 | 488 | 202 | 154 | 138 | 159 | 255 | 278 | 337 | 359.25 |
| 1981 | 143 | 1106 | 645 | 752 | 513 | 313 | 189 | 268 | 292 | 570 | 542 | 387 | 476.67 |
| 1982 | 386 | 360 | 398 | 1634 | 653 | 637 | 276 | 158 | 136 | 117 | 292 | 314 | 446.75 |
| 1983 | 417 | 513 | 1005 | 1446 | 1199 | 565 | 177 | 184 | 130 | 176 | 559 | 1085 | 621.33 |
| 1984 | 376 | 855 | 668 | 1617 | 1111 | 1206 | 396 | 140 | 102 | -9999 | -9999 | -9999 | -9999 |
| |
|
|
|
|
|
|
|
|
|
|
|
|
|
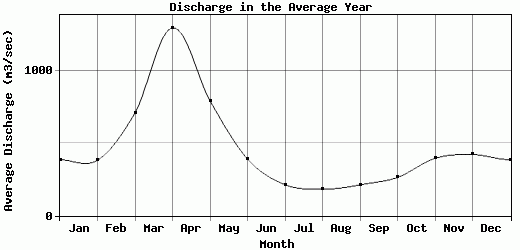
| Avg | 385.59 | 382.64 | 707.73 | 1294.18 | 792.34 | 390.41 | 213.46 | 182.36 | 212.53 | 263.77 | 395.41 | 421.16 | 467.12 |
| |
|
|
|
|
|
|
|
|
|
|
|
|
|
| Std Dev | 169.91 |
196.88 |
390.5 |
358.4 |
294.21 |
194.57 |
117.31 |
109.99 |
193.56 |
182.07 |
193.02 |
205.44 |
92.49 |
| |
|
|
|
|
|
|
|
|
|
|
|
|
|
| | Jan | Feb | Mar | Apr | May | Jun | Jul | Aug | Sep | Oct | Nov | Dec | Avg Annual |
Click here for this table in tab-delimited format.
Tab-delimited format will open in most table browsing software, i.e. Excel, etc.
View this station on the map.
Return to start.