Results
| Country: | U.S.A.
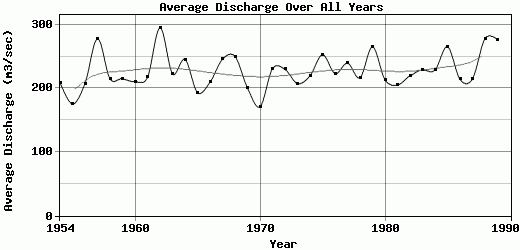
| | Station: | CHITINA AK | | River: | COPPER R | | Area: | 53350.84 | | Lat: | 61.46 | | Lon: | -144.45 | | Source: | USGS | | PointID: | 15212000 | | Area Units: | km2 | | Discharge Units: | m3/sec | | Starting Year: | 1954 | | Ending Year: | 1990 | | Total Years: | 37 | | Total Usable Years: | 36 | |
| |
| Year | Jan | Feb | Mar | Apr | May | Jun | Jul | Aug | Sep | Oct | Nov | Dec | Avg Annual |
|---|
| 1954 | 56.63 | 53.8 | 53.8 | 62.3 | 243.07 | 361.7 | 504.86 | 625.9 | 263.5 | 130.16 | 96.28 | 58.1 | 209.18 |
| 1955 | 56.63 | 51.17 | 52.52 | 69.38 | 159.68 | 290.93 | 518.2 | 457.82 | 227.39 | 98.87 | 65.13 | 56.63 | 175.36 |
| 1956 | 48.14 | 45.31 | 39.64 | 83.54 | 252.93 | 271.72 | 621.79 | 555.29 | 310.42 | 118.92 | 77.87 | 66.41 | 207.66 |
| 1957 | 62.3 | 62.3 | 62.3 | 67.96 | 369.22 | 607.97 | 751.68 | 665.81 | 378.43 | 148.06 | 87.78 | 70.79 | 277.88 |
| 1958 | 76.46 | 65.53 | 50.79 | 72.93 | 179.51 | 427.78 | 653.76 | 587.44 | 239.95 | 73.62 | 79.29 | 73.62 | 215.06 |
| 1959 | 62.3 | 56.63 | 50.97 | 56.63 | 226.29 | 456.56 | 579.86 | 480.66 | 285.48 | 157.01 | 90.61 | 79.2 | 215.18 |
| 1960 | 70.92 | 65.13 | 67.19 | 68.4 | 292.8 | 336.61 | 527.06 | 482.67 | 292.75 | 148.23 | 89.2 | 84.95 | 210.49 |
| 1961 | 86.32 | 68.16 | 66.68 | 64.57 | 278.32 | 495.26 | 485.32 | 526.06 | 266.41 | 126.99 | 76.46 | 67.96 | 217.38 |
| 1962 | 67.96 | 67.96 | 65.13 | 68.06 | 284.59 | 698.3 | 741.45 | 799.64 | 400.35 | 165.18 | 108.47 | 73.62 | 295.06 |
| 1963 | 76.46 | 73.62 | 62.3 | 68.05 | 300.31 | 248.11 | 624.44 | 574.56 | 350.44 | 157.74 | 73.62 | 65.13 | 222.9 |
| 1964 | 70.79 | 65.13 | 59.47 | 59.47 | 112.12 | 705.85 | 715.14 | 573.1 | 272.51 | 149.92 | 84.95 | 76.59 | 245.42 |
| 1965 | 72.56 | 65.13 | 59.47 | 56.63 | 147.39 | 280.9 | 532.82 | 552.67 | 280.75 | 136.69 | 70.79 | 65.13 | 193.41 |
| 1966 | 65.13 | 62.3 | 62.3 | 65.13 | 234.99 | 500.14 | 593.93 | 468.78 | 209.91 | 113.19 | 70.79 | 67.96 | 209.55 |
| 1967 | 65.13 | 65.13 | 65.13 | 70.79 | 266.3 | 506.97 | 593.93 | 663.44 | 360.23 | 125.6 | 85.42 | 79.56 | 245.64 |
| 1968 | 72.16 | 70.79 | 70.79 | 71.91 | 248.45 | 471.67 | 698.79 | 601.78 | 347.27 | 164.48 | 94.11 | 90.02 | 250.19 |
| 1969 | 87.14 | 82.83 | 78.01 | 78.53 | 209.53 | 423.21 | 635.49 | 335.93 | 182.8 | 118.79 | 91.94 | 81.3 | 200.46 |
| 1970 | 75.09 | 73.62 | 70.79 | 71.36 | 153.86 | 250.3 | 456.27 | 413.94 | 222.74 | 133.95 | 76.36 | 54.44 | 171.06 |
| 1971 | 50.97 | 50.97 | 50.97 | 57.53 | 252.13 | 416.64 | 615.39 | 681.25 | 296.29 | 135.36 | 87.69 | 75.18 | 230.86 |
| 1972 | 65.95 | 58.2 | 51.88 | 51.63 | 262.16 | 477.05 | 634.94 | 620.14 | 284.02 | 109.34 | 75.04 | 66.96 | 229.78 |
| 1973 | 65.13 | 65.13 | 65.13 | 72.27 | 186.29 | 446.8 | 605.25 | 490.43 | 258.27 | 109.62 | 69.57 | 57.55 | 207.62 |
| 1974 | 56.63 | 56.63 | 61.02 | 76.83 | 194.99 | 322.04 | 594.38 | 616.4 | 365.35 | 119.98 | 92.03 | 80.57 | 219.74 |
| 1975 | 72.07 | 65.63 | 65.13 | 69.32 | 265.26 | 420.04 | 786.57 | 532.54 | 426.08 | 163.37 | 92.79 | 75.27 | 252.84 |
| 1976 | 70.79 | 67.96 | 68.97 | 77.59 | 219.33 | 423.91 | 524.32 | 644.17 | 227.94 | 181.78 | 97.69 | 74.99 | 223.29 |
| 1977 | 73.62 | 73.62 | 72.16 | 85.71 | 202.75 | 453.45 | 590.82 | 733.78 | 285.21 | 148.23 | 81.18 | 73.62 | 239.51 |
| 1978 | 67.96 | 67.15 | 65.13 | 101.47 | 212.77 | 291.46 | 533.18 | 676.23 | 291.96 | 123.72 | 87.78 | 80.2 | 216.58 |
| 1979 | 74.72 | 73.62 | 73.62 | 111 | 255.68 | 345.86 | 722.17 | 844.03 | 352.45 | 153.6 | 98.17 | 76.36 | 265.11 |
| 1980 | 67.96 | 62.3 | 64.31 | 89.67 | 186.65 | 311.58 | 583.15 | 500.85 | 293.85 | 188.38 | 113.17 | 100.85 | 213.56 |
| 1981 | 89.15 | 87.78 | 87.78 | 96.28 | 202.33 | 372.09 | 553.55 | 482.46 | 220.76 | 112.9 | 84.76 | 74.17 | 205.33 |
| 1982 | 68.69 | 67.96 | 65.13 | 65.7 | 286.09 | 421.55 | 576.84 | 538.39 | 242.15 | 128.75 | 92.69 | 80.2 | 219.51 |
| 1983 | 71.8 | 66.24 | 62.75 | 89.2 | 220.88 | 379.21 | 668.83 | 617.68 | 269.45 | 130.26 | 93.45 | 80.57 | 229.19 |
| 1984 | 73.53 | 69.43 | 72.89 | 86.37 | 172.19 | 366.46 | 632.47 | 619.41 | 309.39 | 166.01 | 97.22 | 81.11 | 228.87 |
| 1985 | 74.99 | 70.79 | 72.71 | 77.68 | 309.66 | 425.98 | 691.76 | 666.36 | 370.74 | 201.14 | 125.73 | 98.65 | 265.52 |
| 1986 | 84.04 | 75.44 | 68.87 | 70.89 | 231.74 | 447.88 | 656.04 | 407.91 | 234.89 | 129.89 | 88.35 | 73.44 | 214.12 |
| 1987 | 65.04 | 62.3 | 62.3 | 78.44 | 179.81 | 351.74 | 676.05 | 549.44 | 255.57 | 130.17 | 90.14 | 76.46 | 214.79 |
| 1988 | 70.15 | 67.96 | 66.04 | 93.35 | 272.71 | 556.71 | 984.15 | 674.95 | 276.29 | 134.03 | 74.19 | 67.96 | 278.21 |
| 1989 | 67.96 | 65.13 | 65.13 | 110.06 | 334.04 | 445.24 | 709.57 | 746.11 | 382.09 | 185.87 | 119.88 | 88.06 | 276.6 |
| 1990 | -9999 | -9999 | -9999 | -9999 | -9999 | -9999 | -9999 | -9999 | -9999 | -9999 | -9999 | -9999 | -9999 |
| |
|
|
|
|
|
|
|
|
|
|
|
|
|
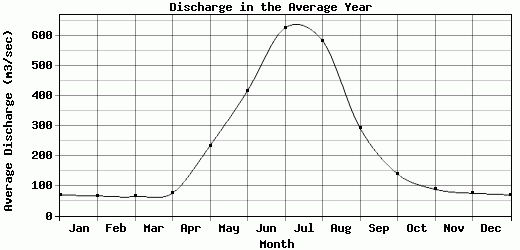
| Avg | 69.54 | 65.8 | 63.87 | 75.46 | 233.52 | 416.94 | 627.06 | 583.56 | 292.61 | 139.44 | 88.35 | 74.82 | 227.58 |
| |
|
|
|
|
|
|
|
|
|
|
|
|
|
| Std Dev | 9.04 |
8.29 |
8.82 |
14.27 |
54.88 |
108.61 |
98.88 |
109.06 |
58.44 |
26.58 |
13.47 |
10.3 |
27.97 |
| |
|
|
|
|
|
|
|
|
|
|
|
|
|
| | Jan | Feb | Mar | Apr | May | Jun | Jul | Aug | Sep | Oct | Nov | Dec | Avg Annual |
Click here for this table in tab-delimited format.
Tab-delimited format will open in most table browsing software, i.e. Excel, etc.
View this station on the map.
Return to start.