Results
| Country: | U.S.A.
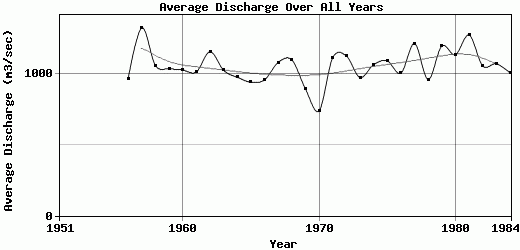
| | Station: | Chitina,Alaska | | River: | Copper | | Area: | 53354 km2 | | Lat: | 61.46 | | Lon: | -144.45 | | Source: | RivDIS | | PointID: | 342 | | Area Units: | km2 | | Discharge Units: | m3/sec | | Starting Year: | 1951 | | Ending Year: | 1984 | | Total Years: | 34 | | Total Usable Years: | 30 | |
| |
| Year | Jan | Feb | Mar | Apr | May | Jun | Jul | Aug | Sep | Oct | Nov | Dec | Avg Annual |
|---|
| 1951 | -9999 | -9999 | -9999 | -9999 | -9999 | -9999 | 3109 | 3168 | 1296 | -9999 | -9999 | -9999 | -9999 |
| 1952 | -9999 | -9999 | -9999 | -9999 | 616 | 1652 | 2788 | 2668 | 1254 | 809 | 509 | -9999 | -9999 |
| 1953 | -9999 | -9999 | -9999 | -9999 | -9999 | -9999 | -9999 | -9999 | -9999 | -9999 | -9999 | -9999 | -9999 |
| 1954 | -9999 | -9999 | -9999 | -9999 | -9999 | -9999 | -9999 | -9999 | -9999 | -9999 | -9999 | -9999 | -9999 |
| 1955 | -9999 | -9999 | -9999 | -9999 | -9999 | -9999 | -9999 | -9999 | -9999 | 402 | 169 | 124 | -9999 |
| 1956 | 76 | 65 | 56 | 99 | 853 | 1815 | 3327 | 2854 | 1273 | 672 | 325 | 206 | 968.42 |
| 1957 | 135 | 104 | 171 | 188 | 1414 | 3256 | 3429 | 3403 | 2375 | 822 | 426 | 203 | 1327.17 |
| 1958 | 203 | 147 | 121 | 120 | 727 | 2944 | 3618 | 2891 | 1034 | 431 | 283 | 215 | 1061.17 |
| 1959 | 124 | 96 | 84 | 84 | 832 | 3092 | 3392 | 2339 | 1192 | 762 | 260 | 200 | 1038.08 |
| 1960 | 174 | 129 | 114 | 168 | 1168 | 2005 | 2899 | 2783 | 1705 | 635 | 310 | 254 | 1028.67 |
| 1961 | 240 | 158 | 118 | 113 | 881 | 2182 | 3114 | 2828 | 1309 | 669 | 339 | 237 | 1015.67 |
| 1962 | 195 | 178 | 167 | 181 | 849 | 2620 | 3783 | 3415 | 1387 | 554 | 331 | 240 | 1158.33 |
| 1963 | 165 | 133 | 138 | 203 | 987 | 1477 | 3650 | 3140 | 1568 | 515 | 184 | 164 | 1027 |
| 1964 | 155 | 158 | 150 | 198 | 436 | 3078 | 3001 | 2508 | 1223 | 484 | 192 | 155 | 978.17 |
| 1965 | 133 | 124 | 119 | 112 | 554 | 1370 | 2855 | 3000 | 1938 | 682 | 252 | 170 | 942.42 |
| 1966 | 130 | 120 | 110 | 130 | 620 | 2600 | 3300 | 2500 | 1200 | 496 | 180 | 130 | 959.67 |
| 1967 | 120 | 110 | 110 | 111 | 818 | 2700 | 3273 | 3126 | 1625 | 505 | 289 | 202 | 1082.42 |
| 1968 | 160 | 152 | 142 | 151 | 1192 | 2471 | 3766 | 3190 | 1200 | 382 | 220 | 189 | 1101.25 |
| 1969 | 158 | 135 | 116 | 135 | 638 | 2825 | 3520 | 1490 | 782 | 558 | 226 | 156 | 894.92 |
| 1970 | 138 | 130 | 126 | 179 | 594 | 1345 | 2360 | 2130 | 987 | 473 | 259 | 173 | 741.17 |
| 1971 | 141 | 119 | 110 | 146 | 609 | 2100 | 4020 | 3790 | 1480 | 500 | 209 | 161 | 1115.42 |
| 1972 | 135 | 123 | 114 | 111 | 863 | 2170 | 3670 | 3500 | 1830 | 486 | 313 | 233 | 1129 |
| 1973 | 184 | 156 | 142 | 197 | 694 | 1970 | 3390 | 2840 | 1150 | 463 | 275 | 255 | 976.33 |
| 1974 | 227 | 227 | 227 | 310 | 933 | 1800 | 3070 | 3100 | 1910 | 529 | 257 | 214 | 1067 |
| 1975 | 189 | 170 | 170 | 192 | 836 | 1770 | 4220 | 2660 | 1830 | 679 | 243 | 172 | 1094.25 |
| 1976 | 159 | 145 | 140 | 150 | 453 | 2000 | 3170 | 3140 | 1140 | 710 | 471 | 394 | 1006 |
| 1977 | 334 | 333 | 320 | 287 | 828 | 2580 | 3600 | 3870 | 1340 | 547 | 289 | 265 | 1216.08 |
| 1978 | 240 | 217 | 190 | 200 | 508 | 1580 | 2950 | 3310 | 1400 | 383 | 299 | 257 | 961.17 |
| 1979 | 229 | 201 | 184 | 331 | 975 | 2220 | 3750 | 3670 | 1470 | 774 | 335 | 247 | 1198.83 |
| 1980 | 218 | 193 | 174 | 181 | 771 | 2489 | 3820 | 2660 | 1278 | 968 | 579 | 313 | 1137 |
| 1981 | 333 | 238 | 173 | 216 | 1189 | 2258 | 3860 | 4548 | 1317 | 787 | 243 | 155 | 1276.42 |
| 1982 | 132 | 113 | 99 | 117 | 884 | 2157 | 3334 | 3003 | 1588 | 667 | 423 | 180 | 1058.08 |
| 1983 | 152 | 129 | 110 | 130 | 703 | 2570 | 3472 | 2801 | 1346 | 796 | 410 | 261 | 1073.33 |
| 1984 | 206 | 184 | 196 | 263 | 713 | 2120 | 3150 | 3404 | 979 | 466 | 245 | 186 | 1009.33 |
| |
|
|
|
|
|
|
|
|
|
|
|
|
|
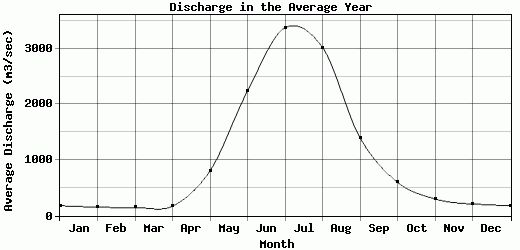
| Avg | 178.79 | 154.72 | 144.52 | 172.52 | 804.6 | 2240.53 | 3376.13 | 3023.52 | 1400.19 | 600.19 | 301.45 | 210.37 | 1056.65 |
| |
|
|
|
|
|
|
|
|
|
|
|
|
|
| Std Dev | 57.76 |
51.96 |
49.4 |
62.01 |
225.89 |
512.38 |
396.2 |
558.36 |
327.35 |
149.14 |
97.28 |
55.88 |
114.95 |
| |
|
|
|
|
|
|
|
|
|
|
|
|
|
| | Jan | Feb | Mar | Apr | May | Jun | Jul | Aug | Sep | Oct | Nov | Dec | Avg Annual |
Click here for this table in tab-delimited format.
Tab-delimited format will open in most table browsing software, i.e. Excel, etc.
View this station on the map.
Return to start.