Results
| Country: | U.S.A.
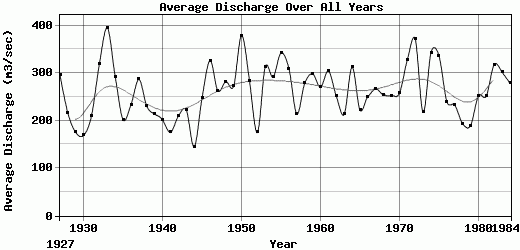
| | Station: | CastleRock, Washington | | River: | Cowlitz | | Area: | 5796 km2 | | Lat: | 46.26 | | Lon: | -122.91 | | Source: | RivDIS | | PointID: | 350 | | Area Units: | km2 | | Discharge Units: | m3/sec | | Starting Year: | 1927 | | Ending Year: | 1984 | | Total Years: | 58 | | Total Usable Years: | 58 | |
| |
| Year | Jan | Feb | Mar | Apr | May | Jun | Jul | Aug | Sep | Oct | Nov | Dec | Avg Annual |
|---|
| 1927 | 407 | 399 | 239 | 237 | 362 | 385 | 149 | 75 | 106 | 270 | 577 | 348 | 296.17 |
| 1928 | 498 | 160 | 376 | 365 | 396 | 178 | 121 | 67 | 51 | 93 | 111 | 172 | 215.67 |
| 1929 | 159 | 121 | 256 | 283 | 402 | 353 | 134 | 65 | 45 | 44 | 39 | 200 | 175.08 |
| 1930 | 143 | 521 | 239 | 276 | 242 | 173 | 87 | 52 | 41 | 56 | 91 | 110 | 169.25 |
| 1931 | 300 | 243 | 300 | 453 | 252 | 160 | 86 | 51 | 45 | 100 | 255 | 280 | 210.42 |
| 1932 | 331 | 317 | 583 | 419 | 379 | 342 | 172 | 71 | 44 | 77 | 634 | 472 | 320.08 |
| 1933 | 484 | 198 | 339 | 277 | 359 | 543 | 276 | 117 | 110 | 257 | 294 | 1490 | 395.33 |
| 1934 | 794 | 275 | 385 | 292 | 202 | 112 | 72 | 54 | 46 | 206 | 574 | 492 | 292 |
| 1935 | 482 | 330 | 255 | 228 | 301 | 269 | 153 | 90 | 64 | 51 | 72 | 125 | 201.67 |
| 1936 | 492 | 240 | 338 | 331 | 454 | 379 | 131 | 68 | 55 | 44 | 34 | 240 | 233.83 |
| 1937 | 110 | 235 | 309 | 468 | 402 | 464 | 178 | 75 | 66 | 68 | 528 | 539 | 286.83 |
| 1938 | 477 | 231 | 299 | 386 | 359 | 236 | 108 | 60 | 49 | 62 | 179 | 314 | 230 |
| 1939 | 368 | 363 | 295 | 286 | 291 | 224 | 129 | 64 | 53 | 57 | 76 | 359 | 213.75 |
| 1940 | 223 | 482 | 384 | 292 | 299 | 116 | 65 | 50 | 47 | 61 | 141 | 255 | 201.25 |
| 1941 | 241 | 146 | 136 | 140 | 189 | 124 | 69 | 52 | 97 | 162 | 225 | 525 | 175.5 |
| 1942 | 187 | 237 | 170 | 203 | 226 | 275 | 140 | 69 | 48 | 46 | 458 | 457 | 209.67 |
| 1943 | 279 | 393 | 263 | 462 | 278 | 282 | 180 | 76 | 55 | 73 | 104 | 225 | 222.5 |
| 1944 | 207 | 212 | 183 | 216 | 229 | 168 | 77 | 52 | 59 | 57 | 119 | 160 | 144.92 |
| 1945 | 350 | 374 | 278 | 280 | 447 | 226 | 103 | 59 | 73 | 64 | 308 | 416 | 248.17 |
| 1946 | 484 | 365 | 343 | 302 | 429 | 357 | 235 | 87 | 59 | 125 | 377 | 757 | 326.67 |
| 1947 | 342 | 419 | 258 | 310 | 257 | 191 | 113 | 61 | 61 | 311 | 487 | 337 | 262.25 |
| 1948 | 412 | 349 | 261 | 281 | 481 | 429 | 150 | 89 | 72 | 127 | 309 | 424 | 282 |
| 1949 | 137 | 397 | 366 | 340 | 546 | 317 | 172 | 86 | 66 | 107 | 327 | 412 | 272.75 |
| 1950 | 419 | 534 | 552 | 389 | 380 | 470 | 278 | 112 | 70 | 207 | 514 | 622 | 378.92 |
| 1951 | 481 | 609 | 284 | 330 | 343 | 226 | 115 | 65 | 52 | 243 | 284 | 381 | 284.42 |
| 1952 | 176 | 368 | 210 | 335 | 356 | 232 | 137 | 68 | 47 | 38 | 36 | 101 | 175.33 |
| 1953 | 756 | 521 | 209 | 244 | 348 | 302 | 206 | 89 | 62 | 98 | 243 | 683 | 313.42 |
| 1954 | 443 | 543 | 287 | 346 | 362 | 387 | 277 | 124 | 90 | 107 | 273 | 262 | 291.75 |
| 1955 | 278 | 329 | 201 | 333 | 336 | 490 | 275 | 109 | 77 | 292 | 656 | 734 | 342.5 |
| 1956 | 491 | 209 | 389 | 427 | 490 | 417 | 245 | 100 | 70 | 151 | 227 | 498 | 309.5 |
| 1957 | 163 | 290 | 444 | 325 | 358 | 204 | 96 | 67 | 53 | 61 | 128 | 380 | 214.08 |
| 1958 | 404 | 458 | 217 | 352 | 339 | 213 | 95 | 63 | 55 | 90 | 563 | 492 | 278.42 |
| 1959 | 611 | 212 | 254 | 330 | 342 | 315 | 152 | 72 | 141 | 309 | 472 | 373 | 298.58 |
| 1960 | 197 | 410 | 293 | 391 | 414 | 309 | 128 | 80 | 69 | 105 | 556 | 291 | 270.25 |
| 1961 | 427 | 759 | 464 | 335 | 394 | 318 | 131 | 72 | 61 | 91 | 169 | 432 | 304.42 |
| 1962 | 371 | 228 | 213 | 358 | 305 | 263 | 136 | 84 | 60 | 130 | 468 | 402 | 251.5 |
| 1963 | 203 | 430 | 213 | 355 | 279 | 171 | 106 | 68 | 62 | 86 | 317 | 269 | 213.25 |
| 1964 | 574 | 300 | 263 | 284 | 330 | 483 | 251 | 117 | 89 | 110 | 229 | 718 | 312.33 |
| 1965 | 550 | 494 | 222 | 276 | 271 | 229 | 116 | 74 | 54 | 62 | 127 | 187 | 221.83 |
| 1966 | 345 | 205 | 361 | 360 | 358 | 250 | 164 | 73 | 55 | 83 | 191 | 560 | 250.42 |
| 1967 | 614 | 381 | 264 | 194 | 335 | 377 | 149 | 68 | 55 | 191 | 222 | 354 | 267 |
| 1968 | 405 | 623 | 321 | 145 | 106 | 117 | 65 | 74 | 88 | 190 | 413 | 501 | 254 |
| 1969 | 530 | 321 | 235 | 220 | 236 | 295 | 134 | 113 | 110 | 211 | 266 | 355 | 252.17 |
| 1970 | 541 | 404 | 286 | 274 | 201 | 109 | 77 | 81 | 128 | 190 | 327 | 476 | 257.83 |
| 1971 | 606 | 424 | 452 | 342 | 294 | 333 | 276 | 119 | 145 | 164 | 332 | 449 | 328 |
| 1972 | 563 | 502 | 764 | 420 | 403 | 415 | 223 | 129 | 126 | 186 | 217 | 509 | 371.42 |
| 1973 | 397 | 206 | 228 | 148 | 144 | 100 | 109 | 118 | 97 | 98.5 | 413 | 556 | 217.88 |
| 1974 | 699 | 483 | 369 | 389 | 364 | 539 | 321 | 117 | 101 | 113 | 224 | 401 | 343.33 |
| 1975 | 635 | 426 | 344 | 260 | 158 | 209 | 218 | 94.5 | 96 | 196 | 420 | 985 | 336.79 |
| 1976 | 597 | 360 | 354 | 246 | 205 | 180 | 201 | 108 | 103 | 157 | 202 | 170 | 240.25 |
| 1977 | 187 | 128 | 217 | 140 | 124 | 111 | 70 | 75 | 95 | 100 | 505 | 1040 | 232.67 |
| 1978 | 389 | 271 | 177 | 174 | 164 | 160 | 113 | 85 | 105 | 134 | 222 | 332 | 193.83 |
| 1979 | 200 | 333 | 199 | 163 | 207 | 160 | 95 | 70 | 80 | 121 | 165 | 480 | 189.42 |
| 1980 | 359 | 310 | 283 | 249 | 259 | 189 | 109 | 89.5 | 121 | 185 | 292 | 576 | 251.79 |
| 1981 | 354 | 411 | 175 | 229 | 226 | 308 | 124 | 74 | 78 | 200 | 322 | 520 | 251.75 |
| 1982 | 464 | 700 | 447 | 303 | 244 | 304 | 134 | 90.5 | 92 | 160 | 337 | 539 | 317.88 |
| 1983 | 575 | 335 | 389 | 272 | 204 | 215 | 224 | 118 | 131 | 130 | 616 | 415 | 302 |
| 1984 | 425 | 324 | 295 | 269 | 328 | 363 | 206 | 114 | 102 | 158 | 397 | 363 | 278.67 |
| |
|
|
|
|
|
|
|
|
|
|
|
|
|
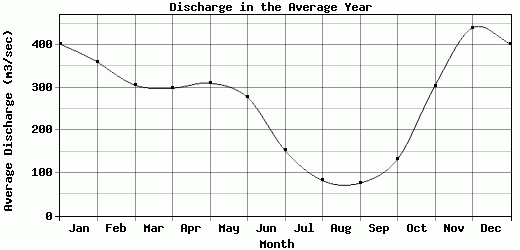
| Avg | 402.34 | 359.45 | 305.69 | 298.86 | 310.16 | 277 | 152.69 | 82.15 | 76.41 | 132.16 | 304.55 | 439.91 | 261.78 |
| |
|
|
|
|
|
|
|
|
|
|
|
|
|
| Std Dev | 163.97 |
137.23 |
109.83 |
81.02 |
95.17 |
115.39 |
64.63 |
21.67 |
27.27 |
70.66 |
166.45 |
235.05 |
55.75 |
| |
|
|
|
|
|
|
|
|
|
|
|
|
|
| | Jan | Feb | Mar | Apr | May | Jun | Jul | Aug | Sep | Oct | Nov | Dec | Avg Annual |
Click here for this table in tab-delimited format.
Tab-delimited format will open in most table browsing software, i.e. Excel, etc.
View this station on the map.
Return to start.