Results
| Country: | Australia
| | Station: | MountNancar | | River: | Daly | | Area: | 47000 km2 | | Lat: | -13.83 | | Lon: | 130.73 | | Source: | RivDIS | | PointID: | 424 | | Area Units: | km2 | | Discharge Units: | m3/sec | | Starting Year: | 1965 | | Ending Year: | 1984 | | Total Years: | 20 | | Total Usable Years: | 13 | |
| |
| Year | Jan | Feb | Mar | Apr | May | Jun | Jul | Aug | Sep | Oct | Nov | Dec | Avg Annual |
|---|
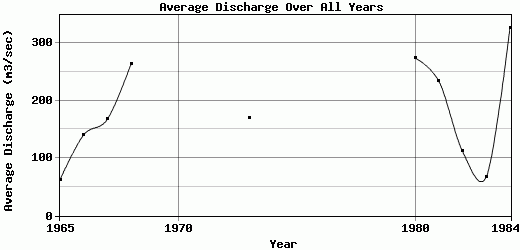
| 1965 | 74 | 33 | 264 | 152 | 21 | 12 | 10 | 9 | 8 | 8 | 9 | 148 | 62.33 |
| 1966 | 391 | 1048 | 103 | 29 | 14 | 12 | 11 | 0 | 9 | 9 | 19 | 39 | 140.33 |
| 1967 | 63 | 739 | 1019 | 61 | 22 | 16 | 14 | 13 | 12 | 11 | 10 | 29 | 167.42 |
| 1968 | 270 | 1396 | 1252 | 67 | 39 | 20 | 17 | 14 | 13 | 12 | 12 | 48 | 263.33 |
| 1969 | -9999 | -9999 | -9999 | -9999 | -9999 | -9999 | -9999 | -9999 | -9999 | -9999 | -9999 | -9999 | -9999 |
| 1970 | -9999 | -9999 | -9999 | -9999 | -9999 | -9999 | -9999 | -9999 | -9999 | -9999 | -9999 | -9999 | -9999 |
| 1971 | -9999 | -9999 | -9999 | -9999 | -9999 | -9999 | -9999 | -9999 | -9999 | -9999 | -9999 | -9999 | -9999 |
| 1972 | -9999 | -9999 | -9999 | -9999 | -9999 | -9999 | -9999 | -9999 | -9999 | -9999 | -9999 | -9999 | -9999 |
| 1973 | 197 | 603 | 914 | 80.5 | 31 | 24.5 | 18.5 | 14.5 | 14 | 14 | 31 | 92.5 | 169.54 |
| 1974 | 631 | 1180 | 1970 | 668 | 137 | 62.5 | 41.9 | 37.1 | -9999 | -9999 | -9999 | -9999 | -9999 |
| 1975 | -9999 | -9999 | -9999 | -9999 | -9999 | -9999 | -9999 | -9999 | -9999 | -9999 | -9999 | -9999 | -9999 |
| 1976 | 571 | -9999 | -9999 | 520 | 75 | 51 | 41 | 34 | -9999 | 28 | 29 | 57 | -9999 |
| 1977 | -9999 | -9999 | -9999 | -9999 | -9999 | 52 | 41 | 34 | 30 | 28 | 31 | 154 | -9999 |
| 1978 | 230 | -9999 | -9999 | -9999 | 27 | 24 | -9999 | -9999 | 22 | 22 | 23 | -9999 | -9999 |
| 1979 | -9999 | 264 | 716 | 43 | 25 | 22 | 21 | -9999 | 20 | 20 | 21 | 28 | -9999 |
| 1980 | 139 | 1780 | 992 | 109 | 50 | 33 | 24.5 | 20 | 18.5 | 18.5 | 21.5 | 83.5 | 274.13 |
| 1981 | 573 | 1550 | 362 | 64 | 36 | 30 | 25.5 | 23.5 | 20.5 | 20 | 44 | 58.5 | 233.92 |
| 1982 | 206 | 319 | 529 | 116 | 10.5 | 26 | 23.5 | 23.5 | 19 | 18 | 20 | 29.5 | 111.67 |
| 1983 | 56 | 69.5 | 374 | 118 | 38.5 | 21 | 18.5 | 18 | 15.5 | 18 | 21.5 | 37.5 | 67.17 |
| 1984 | 341 | 898 | 2300 | 124 | 39.5 | 38.5 | 34.5 | 27 | 21 | 13 | 26.5 | 56 | 326.58 |
| |
|
|
|
|
|
|
|
|
|
|
|
|
|
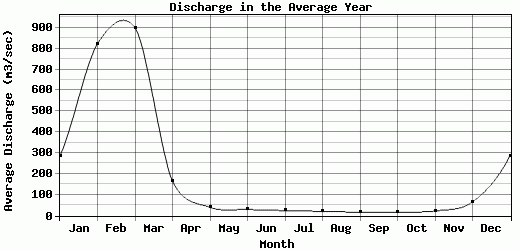
| Avg | 287.85 | 823.29 | 899.58 | 165.5 | 40.39 | 29.63 | 24.42 | 20.58 | 17.12 | 17.11 | 22.75 | 66.19 | 181.64 |
| |
|
|
|
|
|
|
|
|
|
|
|
|
|
| Std Dev | 192.86 |
560.52 |
647.36 |
188.06 |
31 |
14.68 |
10.67 |
10.35 |
5.78 |
6.1 |
9.01 |
40.88 |
85.59 |
| |
|
|
|
|
|
|
|
|
|
|
|
|
|
| | Jan | Feb | Mar | Apr | May | Jun | Jul | Aug | Sep | Oct | Nov | Dec | Avg Annual |
Click here for this table in tab-delimited format.
Tab-delimited format will open in most table browsing software, i.e. Excel, etc.
View this station on the map.
Return to start.