Results
| Country: | Yugoslavia
| | Station: | Bezdan | | River: | Danube | | Area: | 210250 km2 | | Lat: | 45.85 | | Lon: | 18.85 | | Source: | RivDIS | | PointID: | 756 | | Area Units: | km2 | | Discharge Units: | m3/sec | | Starting Year: | 1950 | | Ending Year: | 1984 | | Total Years: | 35 | | Total Usable Years: | 35 | |
| |
| Year | Jan | Feb | Mar | Apr | May | Jun | Jul | Aug | Sep | Oct | Nov | Dec | Avg Annual |
|---|
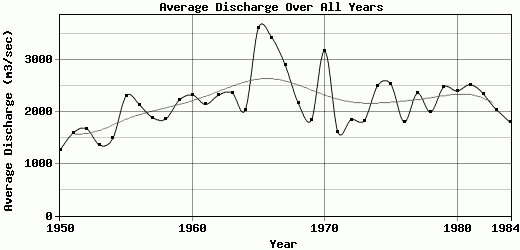
| 1950 | 1140 | 1200 | 1380 | 1250 | 1700 | 1320 | 1160 | 1130 | 1070 | 1020 | 1130 | 1590 | 1257.5 |
| 1951 | 1220 | 1620 | 1640 | 1830 | 2140 | 3050 | 1970 | 1410 | 1160 | 968 | 960 | 1140 | 1592.33 |
| 1952 | 1120 | 1010 | 1570 | 3910 | 1970 | 1990 | 1210 | 1120 | 1140 | 1320 | 2080 | 1670 | 1675.83 |
| 1953 | 1160 | 1160 | 1340 | 1620 | 1620 | 1780 | 2290 | 1440 | 1030 | 1000 | 939 | 890 | 1355.75 |
| 1954 | 896 | 1060 | 1280 | 1380 | 1460 | 2270 | 2510 | 1680 | 1330 | 1420 | 1310 | 1260 | 1488 |
| 1955 | 2190 | 2070 | 1750 | 3490 | 2670 | 2690 | 3560 | 2510 | 1910 | 1720 | 1610 | 1500 | 2305.83 |
| 1956 | 1730 | 1720 | 2400 | 2580 | 2560 | 3320 | 2690 | 2000 | 1740 | 1540 | 1620 | 1720 | 2135 |
| 1957 | 1530 | 2110 | 2420 | 2390 | 1920 | 1970 | 1920 | 2380 | 1810 | 1520 | 1340 | 1310 | 1885 |
| 1958 | 1270 | 1320 | 1920 | 2180 | 2770 | 2020 | 2200 | 2090 | 1460 | 1570 | 1960 | 1560 | 1860 |
| 1959 | 2403 | 1679 | 2056 | 2106 | 2351 | 3141 | 3896 | 3598 | 1690 | 1223 | 1232 | 1244 | 2218.25 |
| 1960 | 1872 | 1613 | 2645 | 2123 | 2192 | 2499 | 2750 | 3489 | 2351 | 2158 | 2082 | 2085 | 2321.58 |
| 1961 | 1702 | 2943 | 2259 | 2308 | 2880 | 3423 | 2417 | 2068 | 1364 | 1033 | 1345 | 1950 | 2141 |
| 1962 | 1697 | 2255 | 2362 | 3354 | 3917 | 4243 | 2905 | 2128 | 1373 | 1046 | 1310 | 1275 | 2322.08 |
| 1963 | 2640 | 2570 | 3600 | 3510 | 2810 | 2530 | 2330 | 1600 | 2180 | 1780 | 1430 | 1390 | 2364.17 |
| 1964 | 1385 | 2083 | 1532 | 2683 | 2768 | 2076 | 1855 | 1519 | 1361 | 1890 | 2817 | 2434 | 2033.58 |
| 1965 | 1920 | 1780 | 2330 | 4630 | 5750 | 7570 | 6080 | 4130 | 2920 | 1970 | 1530 | 2740 | 3612.5 |
| 1966 | 2770 | 4260 | 2960 | 3080 | 3400 | 3460 | 4520 | 5520 | 3940 | 1850 | 2220 | 3140 | 3426.67 |
| 1967 | 3050 | 3350 | 3910 | 4160 | 4050 | 4480 | 3390 | 2170 | 2060 | 1550 | 1302 | 1400 | 2906 |
| 1968 | 2280 | 2100 | 2080 | 2870 | 2250 | 2220 | 2200 | 2800 | 1950 | 2560 | 1460 | 1250 | 2168.33 |
| 1969 | 1540 | 1710 | 2700 | 2410 | 2500 | 2320 | 2220 | 1730 | 1830 | 1010 | 987 | 1090 | 1837.25 |
| 1970 | 1290 | 2320 | 3310 | 4580 | 4820 | 4370 | 3550 | 4180 | 2930 | 2240 | 2220 | 2180 | 3165.83 |
| 1971 | 1340 | 1760 | 1760 | 2320 | 2050 | 2390 | 1970 | 1240 | 1260 | 1020 | 916 | 1260 | 1607.17 |
| 1972 | 1140 | 1040 | 1180 | 1820 | 2400 | 2760 | 2850 | 2760 | 1540 | 1160 | 1780 | 1720 | 1845.83 |
| 1973 | 1010 | 1330 | 1510 | 2380 | 3260 | 2410 | 2220 | 1570 | 1120 | 1550 | 1700 | 1900 | 1830 |
| 1974 | 2180 | 2320 | 2000 | 1880 | 2060 | 2960 | 3460 | 2430 | 1720 | 2490 | 2510 | 3960 | 2497.5 |
| 1975 | 3660 | 2510 | 1740 | 2440 | 2920 | 2890 | 4870 | 2600 | 2480 | 1470 | 1360 | 1400 | 2528.33 |
| 1976 | 2610 | 1890 | 1520 | 1760 | 1900 | 2470 | 1180 | 1720 | 1660 | 1370 | 1380 | 2150 | 1800.83 |
| 1977 | 1410 | 3790 | 3740 | 3020 | 3110 | 2150 | 1990 | 2860 | 1950 | 1250 | 1460 | 1490 | 2351.67 |
| 1978 | 1620 | 1300 | 2510 | 2370 | 2630 | 2520 | 2670 | 1940 | 1690 | 1830 | 1520 | 1330 | 1994.17 |
| 1979 | 1469 | 2254 | 2703 | 3070 | 3150 | 3289 | 3606 | 2193 | 1610 | 1533 | 2017 | 2777 | 2472.58 |
| 1980 | 1770 | 2650 | 1740 | 2680 | 3380 | 2290 | 3600 | 2640 | 1790 | 2220 | 2000 | 2000 | 2396.67 |
| 1981 | 2240 | 2200 | 3200 | 3230 | 2160 | 2310 | 2380 | 2530 | 1910 | 2460 | 2690 | 2900 | 2517.5 |
| 1982 | 3280 | 2880 | 2280 | 2710 | 2530 | 3180 | 2550 | 2340 | 1590 | 1560 | 1360 | 1790 | 2337.5 |
| 1983 | 2598 | 2695 | 2364 | 3052 | 2837 | 2518 | 2061 | 1681 | 1300 | 1212 | 900 | 1191 | 2034.08 |
| 1984 | 1479 | 1518 | 1389 | 2110 | 2277 | 2458 | 2033 | 1809 | 1969 | 2120 | 1188 | 1210 | 1796.67 |
| |
|
|
|
|
|
|
|
|
|
|
|
|
|
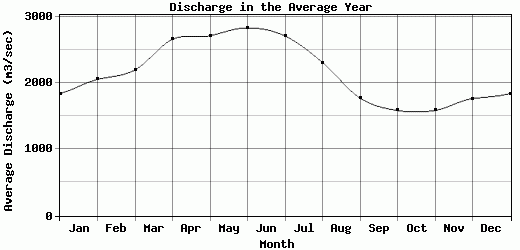
| Avg | 1846.03 | 2059.14 | 2202.29 | 2665.31 | 2718.91 | 2838.2 | 2716.09 | 2314.43 | 1776.8 | 1589.51 | 1590.43 | 1768.46 | 2173.8 |
| |
|
|
|
|
|
|
|
|
|
|
|
|
|
| Std Dev | 680.14 |
756.24 |
718.24 |
819.64 |
873.65 |
1070.67 |
1031.45 |
934.12 |
591.54 |
460.7 |
494.85 |
665.93 |
522.84 |
| |
|
|
|
|
|
|
|
|
|
|
|
|
|
| | Jan | Feb | Mar | Apr | May | Jun | Jul | Aug | Sep | Oct | Nov | Dec | Avg Annual |
Click here for this table in tab-delimited format.
Tab-delimited format will open in most table browsing software, i.e. Excel, etc.
View this station on the map.
Return to start.